Chronic kidney disease (CKD) affects approximately 10% of adult Australians, resulting in significant morbidity and mortality, and placing a large and increasing burden on the healthcare system.1 CKD contributed to 1.4 million hospitalisations for regular dialysis in 2014–15, which was 53% more than in 2005–06.1 For people with CKD, the risk of dying from cardiovascular disease (CVD) is up to 20 times greater than the risk of requiring dialysis or transplantation.2,3
General practitioners (GPs) have a key role in the complex care of patients with CKD. Kidney Health Australia’s CKD management in general practice guidelines provide clinical action plans on the basis of estimated glomerular filtration rate (eGFR) and albuminuria.4 For instance, the yellow action plan is for patients with stage 3a CKD (eGFR 45–59 mL/min/1.73 m2) with a normal urine albumin-to-creatinine ratio (ACR), and includes a 12-monthly review of blood pressure, weight, urine ACR, biochemical profile, eGFR, fasting lipids (total cholesterol and low-density lipoprotein cholesterol [LDL-C]) and glycated haemoglobin (for people with diabetes). The orange action plan is for patients in stage 3a with microalbuminuria (urine ACR 2.5–25 mg/mmol for males or 3.5–35 mg/mmol for females) and patients in stage 3b (eGFR 30–44 mL/min/1.73 m2) with or without microalbuminuria, and includes three-monthly to six-monthly assessments of blood pressure, weight, urine ACR, eGFR, fasting lipids and full blood count.
While it is known that high-quality CKD management attenuates and delays adverse outcomes,5 there is limited research in Australia to examine the monitoring of patients with CKD in primary care, and concordance with practice guidelines. The aim of this study was to describe patterns of monitoring of patients with CKD in Australian general practice in comparison to the recommendations of Kidney Health Australia, and discuss associations with sociodemographic, clinical and health system factors.
Methods
MedicineInsight, developed and managed by NPS MedicineWise with funding support from the Australian Government Department of Health, is the leading large-scale national program in Australia to extract and collate longitudinal, de-identified, whole-of-practice data from the clinical information systems of participating general practices. The MedicineInsight program collects data on patient demographics, encounters (not including progress notes), diagnoses, prescriptions and pathology tests. At July 2017, MedicineInsight had recruited over 650 general practices, giving information from over 3300 GPs and 3.6 million regular patients (those with three or more encounters within two years).
Participants
The study was undertaken using MedicineInsight data from 1 January 2013 to 1 June 2016, collected from 329 general practices across Australia. Regular patients were included if they were aged ≥18 years at the time of data extraction (June 2016) and could be diagnosed (between 1 January 2013 and 31 December 2014) with CKD by their GP on the basis of pathology results (having ≥2 eGFR values <60 mL/min/1.73 m2 and/or ≥2 ACR values ≥3.5 mg/mmol for females or ≥2.5 mg/mmol for males, at least 90 days apart).4 The recorded data for eligible patients were examined over a period of 18 months to observe the pattern of monitoring for specific clinical and laboratory variables.
Variables
Sociodemographic variables that were considered included age group, sex, Indigenous status, socioeconomic index and rurality, and laboratory variables included urine ACR, eGFR, total cholesterol and LDL-C. Additional analyses included systolic and diastolic blood pressure, comorbidities, stage of CKD at baseline, documentation of a diagnosis of CKD, the number of encounters with a GP and continuity of care with GPs during the follow-up period.
Rurality was based on Australian Bureau of Statistics’ Australian Statistical Geography Standard remoteness areas.6 Socioeconomic index was also based on patient postcode, using the Socio-Economic Indexes for Areas (SEIFA) of relative socioeconomic advantage and disadvantage decile. SEIFA is ranked from 1 (most disadvantaged area) to 10 (most advantaged).7 If two blood pressure measurements were registered on the same date, the lowest measurement was used. Documentation of a diagnosis of CKD was extracted from condition codes and manual searches conducted on ‘free-text’ or narrative information in the past medical history, reason for encounter and reason for prescription data fields. The comorbidities examined were based on ‘condition flags’ provided by MedicineInsight, using an algorithm that analyses coded and free-text patient information. CVD, diabetes, hypertension and atrial fibrillation were examined as comorbidities.
Continuity of care (CoC) was calculated using the definition suggested by Maarsingh et al.8 If pi is the proportion of a patient’s visits where the patient sees doctor i, CoC = ∑𝑝𝑖2
For example, if a patient made 10 visits to a GP – eight visits (80%) to doctor A and two visits (20%) to doctor B – the patient’s CoC is 0.82 + 0.22 = 0.68, which would be ‘middle’ CoC. If another patient also made 10 visits to a GP, but five of them to doctor A, four to doctor B, and one to doctor C, the CoC is lower (0.52 + 0.42 + 0.12 = 0.42) and would be ‘low’ CoC. The values ascribed to CoC can range from close to 0 (a very large number of visits, all to different doctors) to 1 (all visits to the same doctor). CoC corresponds with the probability that two randomly selected visits are with the same doctor (or that a particular doctor was the treating doctor for two particular events in a patient’s medical history). GP visits and CoC were considered for the 18 months following laboratory evidence of CKD.
Complete monitoring was defined as having at least one documented assessment for each of the parameters of blood pressure, urine ACR, eGFR and serum lipids (minimum of total cholesterol and LDL-C) within the 18 months following laboratory evidence of stage 3 CKD. Examining monitoring over this time period allowed a six-month leeway, compared with the guidelines’ recommendation of 12 months.4
Data were summarised using percentages/proportions for categorical variables and means with standard deviation (SD) for continuous variables. Multiple logistic regression analysis was used to identify factors associated with patients having complete monitoring. Age group, gender, rurality, socioeconomic status and CKD stage were all automatically included in the regression model. A backwards selection procedure was implemented to determine the final regression model from the other predictor variables, which included the review of nested models and analysis of likelihood ratio tests, and residual plots. Because of the large sample size of patients and measurements, a two-sided P value of <0.001 was deemed to be statistically significant for the logistic regression model. All data cleaning and manipulation and statistical analyses were completed using the statistical and graphical computing language of R.9
The Tasmanian Health and Medical Human Research Ethics Committee approved the study (H0015651).
Results
There were 19,712 eligible adult patients who were identified as being pathologically diagnosable with stage 3 CKD (Table 1).
| Table 1. Characteristics of the patients with stage 3 chronic kidney disease, by sex |
| |
Total
n = 19,712
n (%) |
Male (%)
n = 8,587 (43.5)
n (%) |
Female (%)
n = 11,125 (56.5)
n (%) |
Age group
<70 years
70–79 years
80–89 years
≥90 years |
3,682 (18.7)
6,514 (33.1)
7,455 (37.8)
2,061 (10.5)
|
1,808 (21.1)
3,085 (35.9)
3,059 (35.6)
635 (7.4) |
1,874 (16.8)
3,429 (30.8)
4,396 (39.5)
1,426 (12.8) |
Indigenous status
Aboriginal or Torres Strait Islander
Not Aboriginal or Torres Strait Islander
Not recorded |
195 (1.0)
14,810 (75.1)
4,707 (23.9)
|
80 (0.9)
6,442 (75.0)
2,065 (24.0) |
115 (1.0)
8,368 (75.2)
2,642 (23.7) |
SEIFA
Most disadvantaged
Middle
Most advantaged |
5,441 (27.6)
8,142 (41.3)
5,996 (30.4)
|
2,312 (27.2)
3,536 (41.5)
2,665 (31.3) |
3,129 (28.3)
4,606 (41.6)
3,331 (30.1) |
CKD stage at baseline
3a
3b |
14,544 (73.8)
5,168 (26.2)
|
6,460 (75.2)
2,127 (24.8) |
8,084 (72.7)
3,041 (27.3) |
Comorbidities
CVD
Diabetes
Hypertension |
7,623 (38.7)
5,415 (27.5)
17,332 (87.9)
|
3,830 (44.6)
2,681 (31.2)
7,512 (87.5) |
3,793 (34.1)
2,734 (24.6)
9,820 (88.3) |
Continuity of care
Low
Middle
High
Maximum (1) |
5,157 (26.2)
5,129 (26.0)
5,106 (25.9)
4,271 (21.7)
|
2,200 (25.7)
2,157 (25.2)
2,244 (26.2)
1,966 (22.9) |
2,957 (26.6)
2,972 (26.8)
2,862 (25.8)
2,305 (20.8) |
| GP documentation of CKD |
3,966 (20.0) |
1,799 (21.0) |
2,098 (18.9) |
| CKD, chronic kidney disease; CVD, cardiovascular disease; GP, general practitioner; SEIFA, Socio-Economic Indexes for Areas |
Approximately 50% of the patients were aged ≥80 years, and 56.5% were female. Hypertension (87.9%) was the most commonly flagged comorbid condition, followed by CVD (38.7%) and diabetes (27.5%). GP documentation of a diagnosis of CKD was present for only 20.0% of the patients, and documentation rate decreased significantly with increasing patient age.
Figure 1 shows the monitored laboratory and clinical parameters, organised according to diabetes status. Overall, complete monitoring was performed for 25% of the cohort; the rates were 54.9% among the patients with concomitant diabetes, and 14.1% in patients without concomitant diabetes. Table 2 presents results from the multivariable logistic regression model, showing factors independently associated with complete monitoring. The probability of complete monitoring decreased with increasing age, and patients from the most disadvantaged socioeconomic group were the least likely to have complete monitoring. As with diabetes, patients with CKD who had co-existing hypertension were more likely to have complete monitoring. Patients who had a CKD diagnosis documented by GPs were twice as likely to have complete monitoring, compared with those without such record. Patients with higher CoC were less likely to have complete monitoring; conversely, complete monitoring was more prevalent in patients seeing a GP more frequently: a doubling in the number of GP visits within the 18 months of follow-up increased the odds of complete monitoring by 12%.
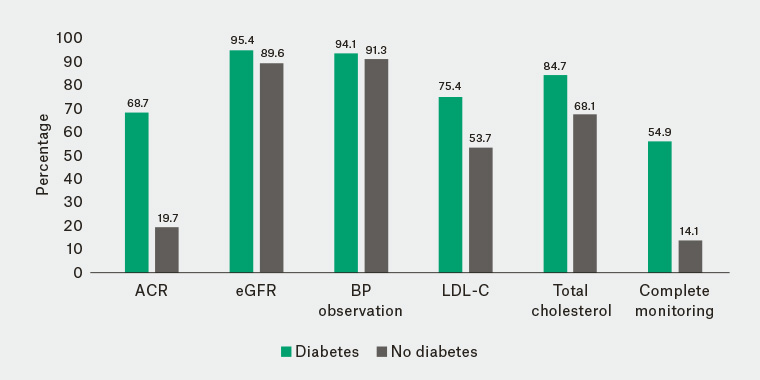
Figure 1. Percentages of patients with stage 3 chronic kidney disease having various laboratory and clinical parameters monitored at least once during the 18-month follow-up period, stratified by diabetes status. ‘Complete monitoring’ denotes having all five parameters (albumin-to-creatinine ratio, estimated glomerular filtration rate, blood pressure, low-density lipoprotein, total cholesterol) recorded at least once.
ACR, albumin-to-creatinine ratio; eGFR, estimated glomerular filtration rate; BP, blood pressure; LDL-C, low-density lipoprotein cholesterol
| Table 2. Factors associated with complete monitoring of patients with stage 3 chronic kidney disease (n = 4928), using logistic regression |
| |
Complete monitoring
n (%) |
Unadjusted OR
(95% CI) |
Adjusted OR
(95% CI) |
P value |
Age group
<70 years
70–79 years
80–89 years
≥90 years |
1,200 (24.4)
2,099 (42.6)
1,588 (32.2)
194 (3.9)
|
Ref
0.98 (0.90, 1.07)
0.57 (0.52, 0.62)
0.22 (0.19, 0.26) |
Ref
0.99 (0.89, 1.09)
0.61 (0.55, 0.68)
0.27 (0.22, 0.32) |
Ref
0.78
<0.0001
<0.0001 |
Sex
Female
Male |
2,563 (23.0)
2,365 (27.5)
|
Ref
1.27 (1.19, 1.36) |
Ref
1.05 (0.97, 1.13) |
Ref
0.22 |
CKD stage at baseline
3a
3b |
3,673 (25.3)
1,255 (24.3)
|
Ref
0.95 (0.88, 1.02) |
Ref
0.91 (0.83, 0.99) |
Ref
0.027 |
SEIFA
Most disadvantaged
Middle
Most advantaged |
1,311 (24.1)
2,226 (27.3)
1,343 (22.4)
|
1.10 (1.01, 1.20)
1.30 (1.21, 1.41)
Ref |
0.83 (0.74, 0.93)
1.08 (0.98, 1.18)
Ref |
0.0008
0.12
Ref |
Rurality
Metro
Inner regional
Outer regional
Remote |
2,822 (24.3)
1,247 (24.2)
717 (28.3)
101 (25.3)
|
Ref
0.99 (0.92, 1.08)
1.23 (1.12, 1.36)
1.70 (1.33, 2.18) |
Ref
1.03 (0.94, 1.13)
1.19 (1.06, 1.34)
1.50 (1.12, 2.01) |
Ref
0.53
0.003
0.007 |
| Presence of diabetes |
2,971 (54.9) |
7.67 (7.14, 8.24) |
7.37 (6.83, 7.95) |
<0.0001 |
| Presence of CVD |
1,971 (25.9) |
1.08 (1.01, 1.15) |
0.95 (0.88, 1.03) |
0.25 |
| Presence of hypertension |
4,565 (26.3) |
1.99 (1.78, 2.23) |
1.41 (1.24, 1.61) |
<0.0001 |
Continuity of care
Low
Middle
High
Maximum (1) |
1,205 (23.4)
1,070 (20.9)
943 (18.5)
673 (15.8)
|
1.44 (1.31, 1.58)
1.27 (1.15, 1.40)
1.29 (1.17, 1.42)
Ref |
1.34 (1.18, 1.48)
1.16 (1.04, 1.30)
1.14 (0.99, 1.25)
Ref |
<0.0001
0.011
0.067
Ref |
| GP encounters (two-fold increase) |
– |
1.24 (1.19, 1.30) |
1.12 (1.06, 1.19) |
<0.0001 |
| GP documentation of CKD diagnosis |
1412 (35.6) |
1.92 (1.78, 2.07) |
2.04 (1.87, 2.23) |
<0.0001 |
| CI, confidence interval; CKD, chronic kidney disease; CVD, cardiovascular disease; GP, general practitioner; OR, odds ratio; SEIFA, Socio-Economic Indexes for Areas |
Observing the large effect of diabetes on complete monitoring, a sub-group analysis was conducted by diabetes status. Among the patients who were not diabetic, complete monitoring was more common when there was GP documentation of CKD diagnosis, compared with no such documentation (odds ratio 2.61, 95% confidence interval: 2.35, 2.90).
Discussion
The results showed that there is room for improvement in monitoring patients with early CKD, when considering alignment with national guidelines. This study included patients diagnosable with CKD based on laboratory evidence, not patients formally ‘diagnosed’ and recorded as having CKD by their GPs. In fact, only 20% of the patients had a diagnosis of CKD documented, and these patients were twice as likely to have the recommended monitoring, compared with the patients who did not have a CKD diagnosis documented. The low rate of documentation of CKD is comparable with previous Australian general practice–based studies.10,11 Similarly, CKD documentation rates of only 27% were reported from Canada for patients with CKD,12 and 16% from the US for patients with stage 3 or 4 CKD.13
Our results suggest that there is a significant deficiency in the monitoring of ACR in patients without diabetes. International studies have reported comparable ACR testing rates. In a US study, the rate was only 30%, although the study included patients with stage 4 CKD.14 In the Netherlands, the ACR testing rate was 40% among patients with stage 3 CKD, although a 15-month time frame was used.15 In Canada, only half of the patients received follow-up ACR tests after an initial abnormal kidney test,16 while others have reported that ACR monitoring was performed for only 16% of the patients with a low eGFR.12
In this study, patients with CKD who also had diabetes were better monitored, compared with patients without diabetes. Several other studies have reported similar findings.14,17 Diabetes is a national health priority in Australia.18 Kidney status in people with type 2 diabetes should be assessed by annual screening of albuminuria and eGFR.19 The current Practice Incentives Program for diabetes monitoring is likely to enhance the delivery of care.19 Moreover, awareness of diabetes is higher than that of CKD, with fewer than 10% of people with CKD being aware of their condition.20 The rising prevalence and the burden of CKD is a recent phenomenon. It may take several years before it influences general practice incentive funding policies, with potential incentives for care similar to those that currently exist for diabetes. This should be considered in relation to the cost of management of patients requiring renal replacement therapy.
The observed lower rates of both complete monitoring and having a documented diagnosis of CKD among older patients are probably related, with an expectation that kidney function normally deteriorates with advancing age.21,22 There is potentially a reluctance to label these older patients with a formal diagnosis of CKD.22,23 In addition, practice guidelines tend to be less applicable to elderly patients with multiple comorbidities.24 It was beyond the scope of this study to investigate the reasons for suboptimal monitoring. However, others have reported a lack of awareness and relative newness of guidelines,25 the length of guideline documents, perceived lack of evidence supporting guidelines, and provider time constraints26 as potential reasons for poor adherence to clinical guidelines.
This study comprised a large cohort of patients from general practices across the country. The patient characteristics of the dataset were similar to the Australian population. Despite the strengths, this study has some limitations. Each general practice has chosen to be part of the MedicineInsight program. Patient information was collected by GPs for clinical decision making, not research purposes. All health and demographic information may not have been entered in the medical record system. For example, Aboriginal and Torres Strait Islander status was missing for approximately 24% of the patients. Tracking patients’ attendance at multiple practices was not possible. Also, the study did not look at the specific timing of monitoring. For instance, it is possible that patients could have had their monitoring performed very soon after the initial diagnosis of stage 3 CKD, without any further monitoring over the next 18 months; yet, this would have fulfilled our definition for complete monitoring.
In conclusion, over an 18-month period, blood pressure, ACR, eGFR and serum lipids were all monitored for only one-quarter of patients with evidence of stage 3 CKD. Increased education for GPs about the management of CKD may improve the situation. In light of GPs’ time constraints, the documentation of CKD electronically, to remind GPs to order parameters for monitoring, seems a possible simple solution.