Osteoporosis is a prevalent disease in Australia with high health costs, morbidity and mortality.1 It is treatable or preventable with a number of effective therapies that either prevent bone loss or encourage bone gain.2 Once a minimal trauma fracture has occurred, any risk of future fracture roughly doubles and there is consensus that antiresorptive treatment should be initiated. However, the preferable approach would be prevention of first fracture in patients at high risk.
The Royal Australian College of General Practitioners (RACGP) and Osteoporosis Australia have issued guidelines for the initiation of antiresorptive therapy for patients, based on age, bone mineral density (BMD) and a calculation of absolute fracture risk over 10 years (Figure 1).3 These guidelines advocate starting treatment for patients where the absolute 10-year risk of hip fracture is >3% or the risk of any fracture is >20%, or the t-score on BMD scan (unspecified site) is –2.5 or lower. However, in Australia, Pharmaceutical Benefits Scheme (PBS) subsidy for osteoporosis medications is not available on fracture risk calculation alone. The PBS criteria for subsidised antiresorptive therapy with osteoporosis medications (Box 1) are a prevalent minimal trauma fracture, or age ≥70 years with BMD t-score ≤–2.5, or long-term glucocorticoids with low bone density (bisphosphonates only). If a patient does not qualify on PBS criteria for antiresorptive therapy, the RACGP and Osteoporosis Australia guidelines recommend use of absolute fracture risk calculators to guide decisions on treatment.
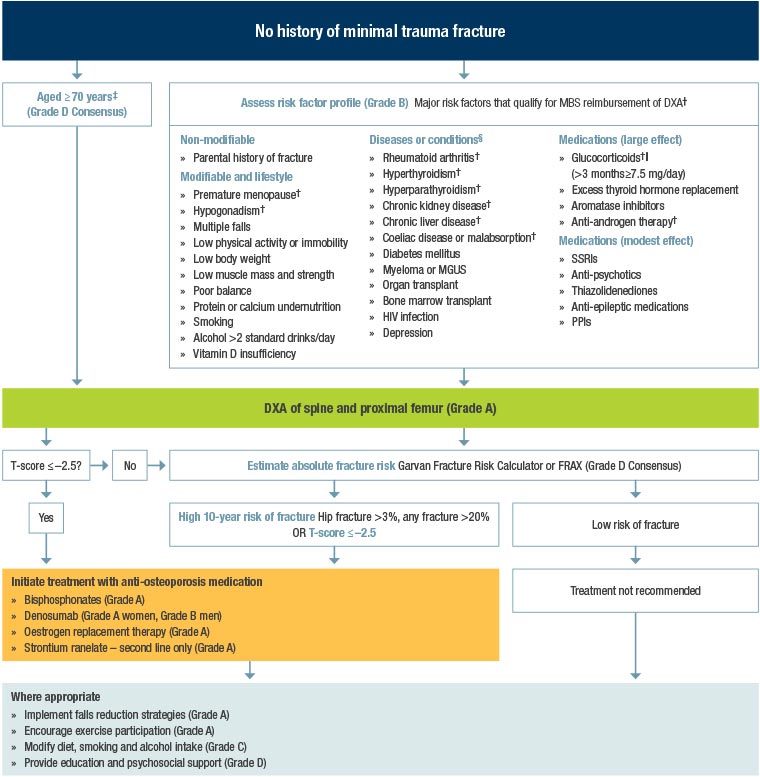
Figure 1. Clinical guidelines flowchart3. Click here to enlarge
†Qualifies for MBS reimbursement of BMD testing
‡Consensus recommendation. The MBS reimburses costs for measurement of BMD testing in any person aged ≥70 years.
||See other guidelines specific to glucocorticoid treatment for more information and recommendations regarding glucocorticoid use and risk of osteoporosis and fracture.
§Treatment of an underlying condition may improve bone strength.
BMD, bone mineral density; DXA, dual energy X-ray absorptiometry; FRAX, Fracture Risk Assessment Tool; HIV, human immunodeficiency virus; MBS, Medicare Benefits Schedule; MGUS, monoclonal gammopathy of undetermined significance; PPIs, proton pump inhibitors; SSRIs, selective serotonin reuptake inhibitors
Reproduced with permission from The Royal Australian College of General Practitioners and Osteoporosis Australia, Osteoporosis prevention, diagnosis and management in postmenopausal women and men over 50 years of age, 2nd edn, East Melbourne, Vic: RACGP, 2017, p. vii. Extract from flowchart for management of patients who have not yet had a minimal trauma fracture.
| Box 1. Pharmaceutical Benefits Scheme indications for osteoporosis medications |
Antiresorptive therapy
- Fracture due to minimal trauma, radiologically confirmed (vertebral fracture >20% reduction in height) or
- Age >70 years with t-score –2.5 or less (bisphosphonates and denosumab only) or
- Long-term high-dose corticosteroid therapy and t-score –1.5 or less (bisphosphonates only)
Teriparatide therapy
- Must be treated by a consultant physician
- t-score of –3.0 or less
- Two or more fractures due to minimal trauma
- One symptomatic new fracture after at least 12 months continuous therapy with an antiresorptive agent at adequate dose
|
A calculation of absolute fracture risk is commonly provided with BMD reports in Australia, usually using either FRAX (Australia) or Garvan Fracture Risk Calculator (Garvan).4,5 Both risk calculators use the BMD at the femoral neck as the basis for the calculation, and both are based on fracture incidence data from the Dubbo Osteoporosis Epidemiology Study (DOES).6–9 However, there are differences between the two calculators in the additional information used. FRAX is available for different countries and ethnicities and includes weight and height, family history, smoking, glucocorticoid therapy, rheumatoid arthritis, secondary causes of osteoporosis, alcohol use and previous fracture, whereas Garvan includes recent falls and previous fracture (Table 1). FRAX provides predictions for hip fracture and for major osteoporotic fractures including hip, clinical spine (symptoms and confirmatory radiography), forearm, and proximal humerus, whereas Garvan provides predictions for hip fracture and for all fragility fractures except digits, face, cervical spine and skull. In addition, FRAX makes a statistical adjustment for competing mortality.
| Table 1. Parameters used by FRAX and Garvan Fracture Risk Calculator to calculate absolute future risk of fracture |
| Garvan Fracture Risk Calculator |
FRAX (Australia) calculator |
- Age
- Male or female
- Femoral neck t-score
- Previous fracture (0 to 3+)
- Falls (0 to 3+) in the last 12 months
|
- Age
- Male or female
- Femoral neck t-score
- Previous fracture (yes or no)
- Weight and height
- Parent hip fracture
- Current smoking
- Glucocorticoid therapy
- Rheumatoid arthritis
- Secondary osteoporosis
- Alcohol ≥3 units per day
- Country +/– ethnicity
|
We examined whether the decision to treat a patient with bone-preserving medication, as per the RACGP and Osteoporosis Australia guidelines using calculation of absolute fracture risk over 10 years, would be different depending on whether Garvan or FRAX was used.
Methods
Garvan and FRAX (Australia) were interrogated for the 10-year risk for hip fracture and for other fractures for men and women without a prevalent fracture. Data were entered for hypothetical patients – male and female – in five-year age increments from ages 50 to 85 years, and from femoral neck t-scores in 0.5 decrements from +3.0 to –3.0. For FRAX, the study used as standard the average height and weight of the Australian men and women published by the Australian Bureau of Statistics (ie 175.6 cm and 85.9 kg for men, and 161.8 cm and 71.1 kg for women). We did not input other risk modifiers that are peculiar to one risk calculator (as listed in Table 1) in order to minimise differences in raw data input. The RACGP and Osteoporosis Australia guidelines include BMD as a necessary element in the algorithm, so risk calculation without BMD was not included although both calculators do provide it.
Results
The study found that Garvan consistently predicted a higher absolute fracture risk than FRAX (Australia). The discrepancy between the two increased with increasing age and decreasing BMD. The discrepancy was most pronounced in the prediction of any fracture, but less so for hip fracture.
Table 2 tabulates the corresponding hip fracture risk calculations for a given age and t-score, highlighting where the calculator meets the RACGP and Osteoporosis Australia guidelines’ threshold of a 10-year risk of hip fracture of 3%. The discrepancy between the Garvan and FRAX calculators was greater for risk of all fractures. With age advancing >65 years, fracture risk estimates reach the suggested threshold for intervention at non-osteoporotic t-scores (ie above –2.5). For example, Garvan calculates a 10-year hip fracture risk for a woman aged 80 years as 3% at a t-score of –1.0, whereas in a woman aged 50 years a t-score of –2.5 predicts a 10-year hip fracture risk of only 2%.
The PBS subsidy requirement for a patient without a prevalent fragility fracture (ie age ≥70 years with a dual-energy X-ray absorptiometry (DXA) t-score of –2.5 or less) was found for women to correspond to a 10-year hip fracture risk of 2.9% by FRAX and 5.7% by Garvan, and a 10-year risk of a major osteoporotic fracture of 7.8% by FRAX and of any fragility fracture of 21.0% by Garvan. Conversely, the suggested threshold for intervention is reached as early as age 50 years for a woman with a t-score of –3.0 where there is no PBS subsidy for specific osteoporosis medications, oestrogen treatment excluded.
Discussion
BMD alone is not the only, or even the major, determinant of fracture. This is substantiated by the fact that most minimal trauma fractures do not occur in patients with osteoporosis by the DXA definition (Box 2). Risk calculators, like Garvan and FRAX, inform us of absolute risk, taking into account BMD, age and other factors such as medications, falls and family history. However, risk calculators are not perfect and they do not concur on the predicted risk.
| Box 2. Dual-energy X-ray absorptiometry (DXA) definitions |
z-score compares the patient’s bone mineral density (BMD) with that of adults of the same age and sex
- Expressed as standard deviation (SD) from the mean age-matched bone density
t-score compares the patient’s BMD with that of young adults of the same sex
- Expressed as SD from the mean of people aged 30 years
The definition of osteoporosis or low bone density (previously called osteopenia) is based on t-score
- Normal bone density = t-score –1.0 or above
- Low bone density = t-score between –1.0 and –2.5
- Osteoporosis = t-score –2.5 or below
|
The decision to prescribe osteoporosis medications for a patient for prevention of future osteoporotic fracture on the basis of 10-year fracture risk may depend on which risk calculator is used. We found a marked discrepancy between Garvan and FRAX, and there are many instances when treatment may be recommended, as per the RACGP and Osteoporosis Australia guidelines, if the Garvan risk calculator is used but not if the FRAX calculator is used. It is also apparent that age is the most important factor in determining fracture risk, since at >65 years fracture risk estimates can fulfil the RACGP criteria for intervention in patients with normal or low BMD. This concurs with the epidemiology reporting that most minimal trauma fractures occur in patients who do not have osteoporosis by the DXA definition.10
There are some reasons to expect this discrepancy. Garvan includes all fragility fractures (excluding hands, feet, face, cervical spine and skull) in its predictive model, whereas FRAX limits the prediction to major osteoporotic fractures. This does not explain the discrepancy between the two calculators’ estimates of hip fracture. A real-life study by Billington et al in 122 women in New Zealand found a similar discrepancy between FRAX (UK) and Garvan in hip fracture prediction, which was magnified by the addition of the history of falls or fractures in the Garvan model.11
The statistical adjustment for competing mortality in FRAX may affect the FRAX calculation of hip fracture since that is a fracture occurring in the older population. Adjustment for competing mortality in amending cancer risk prediction has been debated recently.12 The risk of a given condition over a given interval (eg 10 years) depends upon the prediction of survival over that interval. For older patients there are factors that would lead to mortality competing with hip fracture risk over the time of prediction. FRAX adjusts for this. Garvan does not. This contributes to the discrepancy in hip fracture predictions between FRAX and Garvan with increasing age (Table 2). Whether an adjustment for competing mortality, similar to that used for cancer incidence, is appropriate for fracture risk is debatable. The latter may be preventable with therapeutic intervention, whereas the former may be treatable but not necessarily preventable.
| Table 2. Absolute 10-year risk of hip fracture for men and women at a given age and femoral neck t-score. The shading indicates where fracture risk estimates reach the threshold for treatment suggested by The Royal Australian College of General Practitioners and Osteoporosis Australia guidelines – yellow shading for Garvan, green shading for FRAX. |
| Age (years) |
|
10-year risk of hip fracture (%) |
| |
|
Female |
Male |
|
Femoral neck
t-score
|
FRAX* |
Garvan |
FRAX* |
Garvan |
| 50 |
0 |
0.0 |
0.3 |
0.0 |
0 |
| –0.5 |
0.0 |
0.4 |
0.0 |
0.1 |
| –1 |
0.1 |
0.6 |
0.0 |
0.1 |
| –1.5 |
0.2 |
0.9 |
0.1 |
0.2 |
| –2 |
0.3 |
1 |
0.5 |
0.4 |
| –2.5 |
0.7 |
2 |
1.0 |
0.6 |
| –3 |
1.3 |
3 |
1.9 |
1 |
| 55 |
0 |
0.0 |
0.3 |
0.1 |
0.1 |
| –0.5 |
0.1 |
0.5 |
0.1 |
0.1 |
| –1 |
0.1 |
0.8 |
0.2 |
0.2 |
| –1.5 |
0.2 |
1 |
0.4 |
0.4 |
| –2 |
0.4 |
2 |
0.7 |
0.6 |
| –2.5 |
0.8 |
3 |
1.2 |
1 |
| –3 |
1.5 |
4 |
2.3 |
2 |
| 60 |
0 |
0.1 |
0.4 |
0.1 |
0.1 |
| –0.5 |
0.1 |
0.7 |
0.2 |
0.2 |
| –1 |
0.2 |
1 |
0.3 |
0.4 |
| –1.5 |
0.4 |
2 |
0.5 |
0.6 |
| –2 |
0.6 |
2 |
0.9 |
1 |
| –2.5 |
1.1 |
3 |
1.6 |
2 |
| –3 |
2.0 |
5 |
2.7 |
3 |
| 65 |
0 |
0.1 |
0.6 |
0.2 |
0.2 |
| –0.5 |
0.2 |
0.8 |
0.3 |
0.4 |
| –1 |
0.4 |
1 |
0.5 |
0.6 |
| –1.5 |
0.6 |
2 |
0.8 |
1 |
| –2 |
1.0 |
3 |
1.3 |
2 |
| –2.5 |
1.7 |
4 |
2.2 |
3 |
| –3 |
3.0 |
7 |
3.5 |
5 |
| 70 |
0 |
0.3 |
0.7 |
0.4 |
0.4 |
| –0.5 |
0.4 |
1 |
0.6 |
0.7 |
| –1 |
0.7 |
2 |
0.9 |
1 |
| –1.5 |
1.1 |
3 |
1.4 |
2 |
| –2 |
1.8 |
4 |
2.1 |
3 |
| –2.5 |
2.9 |
6 |
3.2 |
5 |
| –3 |
4.8 |
9 |
4.9 |
8 |
| 75 |
0 |
0.5 |
0.9 |
0.7 |
0.7 |
| –0.5 |
0.8 |
1 |
1.0 |
1 |
| –1 |
1.2 |
2 |
1.5 |
2 |
| –1.5 |
1.9 |
3 |
2.1 |
3 |
| –2 |
2.8 |
5 |
3.0 |
5 |
| –2.5 |
4.5 |
7 |
4.4 |
8 |
| –3 |
7.0 |
11 |
6.2 |
13 |
| 80 |
0 |
0.9 |
1 |
1.1 |
1 |
| –0.5 |
1.3 |
2 |
1.4 |
2 |
| –1 |
1.9 |
3 |
1.9 |
3 |
| –1.5 |
2.7 |
4 |
2.6 |
5 |
| –2 |
3.9 |
6 |
3.5 |
8 |
| –2.5 |
5.7 |
9 |
4.5 |
13 |
| –3 |
8.4 |
14 |
6.5 |
21 |
| 85 |
0 |
1.3 |
2 |
1.4 |
2 |
| –0.5 |
1.8 |
2 |
1.7 |
3 |
| –1 |
2.5 |
4 |
2.1 |
5 |
| –1.5 |
3.4 |
5 |
2.7 |
9 |
| –2 |
4.5 |
8 |
3.5 |
14 |
| –2.5 |
6.2 |
12 |
4.4 |
22 |
| –3 |
8.6 |
17 |
5.7 |
33 |
| *As FRAX requires the input of height and weight, the average height and weight of Australian men and women was used in the calculator. |
If a calculation of absolute fracture risk over 10 years is to be used in the decision to start antiresorptive therapy, which risk calculator should be used? Patients with a low risk of fracture should not be exposed to unnecessary treatment, but there is a need to prevent fractures in those patients at risk. Does Garvan overestimate future fracture risk or does FRAX underestimate it?
This question has been addressed by Holloway-Kew et al in comparing estimated fractures to observed incident fractures in the Geelong Osteoporosis Study.13 Overall, they found that both risk calculators tended to underestimate incident fractures. FRAX significantly underestimated major osteoporotic fracture for both men and women and hip fracture for women. Garvan significantly underestimated fragility fractures for women. Somewhat reassuringly, the discrepancies were generally less between predicted and observed hip fracture, which is the most threatening fracture for life and independence.
Why does this discrepancy occur? Is there a significant difference between the demographics of the parent database from Dubbo and the Geelong cohort that could influence fracture risk prediction? Dubbo is a relatively sparsely populated semi-urban isolated city in country New South Wales, whereas Geelong is a more densely populated major city close to Melbourne.14,15 This raises the question as to whether there would be significant differences between Australian populations or ethnicities where one risk engine may perform better than another. For instance, and by contrast, a study of the performance of Garvan and FRAX (New Zealand) in 1170 older female volunteers in New Zealand found that Garvan overestimated the 10-year incidence of hip fracture: 6.0% (5.6–6.5%) predicted versus 4.0% observed.16 This is arguably a less serious problem than an underestimation of risk that may lead to under-treatment.
The other factor contributing to fracture risk, apart from age and bone density, and the other modifiers included in the two calculators, is bone turnover, which is an independent predictor of fracture risk.17 However, studies of the addition of bone turnover markers to fracture risk prediction using age and BMD have produced mixed results in terms of improvement in precision, particularly in men and partly related to assay imprecision.18,19 It has been known for a long time that high resorption markers predict rapidity of bone loss in postmenopausal women.20 For that reason alone it is likely that bone resorption markers, in addition to a risk calculator, would help decision making about intervention. However, recommendations about the use of bone turnover markers, either in initiating or in monitoring treatment, have not yet been developed for general practice.
It may be said that the limitation of the current study is using hypothetical male and female patients of average weight and height. However, our purpose was to examine at which age and DXA t-score the recommended threshold for intervention would be reached using the respective risk calculators, which might lead to differences in prescriptions of antiresorptive medications, differences in fracture prevention, and differences in medication costs. It was not our purpose to determine which calculator was more accurate, although the publication from Holloway-Kew et al suggests that both underestimate risk. Finally, despite the recommendations about intervention based on fracture risk, and in the absence of high-dose glucocorticoid therapy or a prevalent minimal trauma fracture, no PBS-funded osteoporosis medication is available based on fracture risk until the patient reaches the age of 70 years and has a t-score less than –2.5.
Conclusion and implications for general practice
There is a marked discrepancy between Garvan and FRAX, and there are many instances when treatment may be recommended, as per the RACGP and Osteoporosis Australia guidelines, if the Garvan risk calculator is used but not if the FRAX calculator is used.
Providers of DXA scans should understand that these differences exist, and state which risk calculator is being used on reports. This information and understanding of the differences will aid clinicians in decisions about treatment. Yet, currently, despite the published guidelines, calculated absolute fracture risk is not recognised in Australia as an indication for reimbursement of osteoporosis treatments.