Colorectal cancer (CRC) is the second most commonly diagnosed cancer and is second only to lung cancer as the leading cause of cancer death in Australia.
1 Despite being one of the most preventable cancers and the existence of a free National Bowel Cancer Screening Program (NBCSP), screening rates remain low.
2 In fact, only about 36% of the 1.4 million people invited in 2014 by the NBCSP returned a completed faecal occult blood screening kit (FOBT) for analysis.
3 One of the reasons for poor screening uptake may be people’s inaccurate perceptions of their own risk of developing CRC.
4
A large proportion of Australians who are at average risk of CRC are undergoing unnecessary colonoscopies against National Health and Medical Research Council (NHMRC) guidelines, despite the risks involved in the procedure and the financial burden this places on the healthcare system.5 Conversely, the majority of Australians who are at above average risk, who would benefit most from colonoscopies, are getting inadequate screening or not being screened at all.5,6
Risk-stratification is increasingly proposed as a method for improving the efficacy of cancer screening. In order to maximise screening that is appropriate to the actual risk level, risk should be presented in a meaningful way to help patients develop a more accurate perception of their risk. The NHMRC-funded Centre for Research Excellence on optimising CRC screening has developed the risk assessment tool CRISP (Colorectal Cancer RISk Prediction) for this purpose.7
Evidence suggests that the format in which risk information is presented affects patients’ understanding and perception of risk.8 Communicating risks as absolute rather than relative risk delivers more transparent and complete risk information without causing people to overestimate benefits or harms.9–15 Previous studies have also found that communicating probability information in numbers rather than words improves people’s accuracy of risk perception.10,14,16–19 Using natural frequencies instead of percentages to explain risk has also been shown to be more intuitive and better understood.10–14,16,20–23 Moreover, line graphs can be useful to show comparative risk over time, and icon arrays may help people to identify themselves as one of the icons.10,13,16
More recently, expected frequency trees (EFT) have been proposed as a more comprehensive format for effectively communicating the potential harms and benefits of screening, by demonstrating the predictive accuracy of a screening test and the potential complications of having a screening test. EFTs have been hypothesised to improve informed decision making about screening methods by simplifying conditional probabilities.12,16,24
Previous literature also suggests that people are far more likely to be influenced by the views of those around them (including strangers) than by advice from governments.25 So in addition to testing the various risk communication formats, we examined the impact on people’s CRC screening choice of presenting recommendations in two ways: one based on national health guidelines and the other on social norms. One important person around patients is their general practitioner (GP), whose influence, even in only a letter, has been shown to increase participation in CRC screening.26–28 It is likely that an in-person CRC screening recommendation from the GP has an even larger effect on uptake. The CRISP-Q study compared the impact of various risk formats on patients’ ability to choose a CRC screening test that is appropriate to their level of CRC risk.
Methods
Study design and participants
This was an observational, cross-sectional, vignette-based study. Patients in the waiting room of a Melbourne general practice were approached and invited to participate in the study if they were aged 40–75 years, understood English and were waiting for an appointment with their GP. Patients were deemed ineligible if they were not seeing a GP, non–English speaking, acutely unwell, distressed, or flagged by medical or administrative staff as inappropriate to recruit. The CRISP-Q study was approved by the University of Melbourne Human Research Ethics Committee (HREC 1545587.2).
Procedures
Ten different risk communication screens were developed with five formats and two different levels of CRC risk (average and relative risk of 6, consistent with NHMRC moderately increased risk; Figures 1–5 [Figure 5 available online only]). The formats were:
-
Icon array demonstrating five-year CRCrisk
-
Comparative risk line graph showing personal CRC risk over time against the average risk
-
EFT showing outcomes of a hypothetical population of 100,000 (average or moderate risk) who receive no screening, FOBT or colonoscopy screening.
-
Absolute five-year risk of CRC (AR) and Australian Government recommendation
- Absolute five-year risk of CRC (AR) and social norm statement (eg ‘Most people like you would choose the FOBT test')
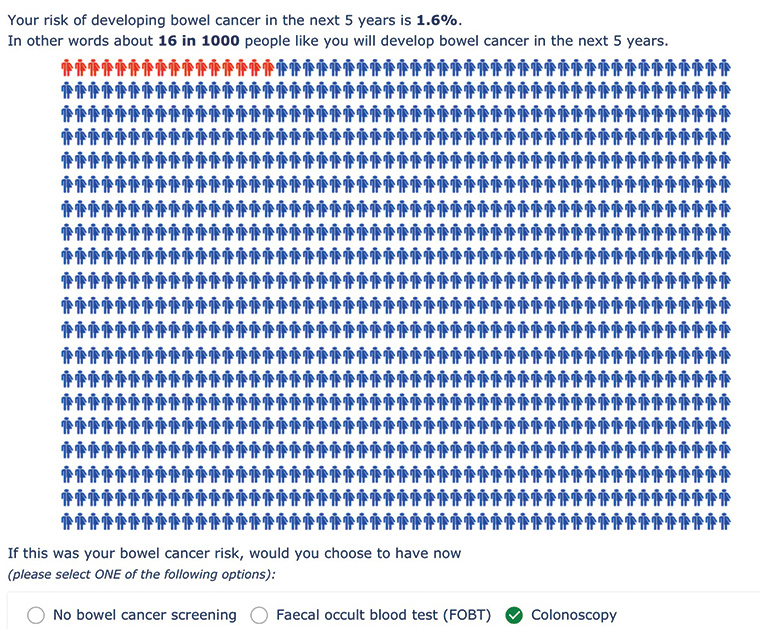
Figure 1. Risk format 1– Icon array depicting absolute risk over five years (for increased risk)
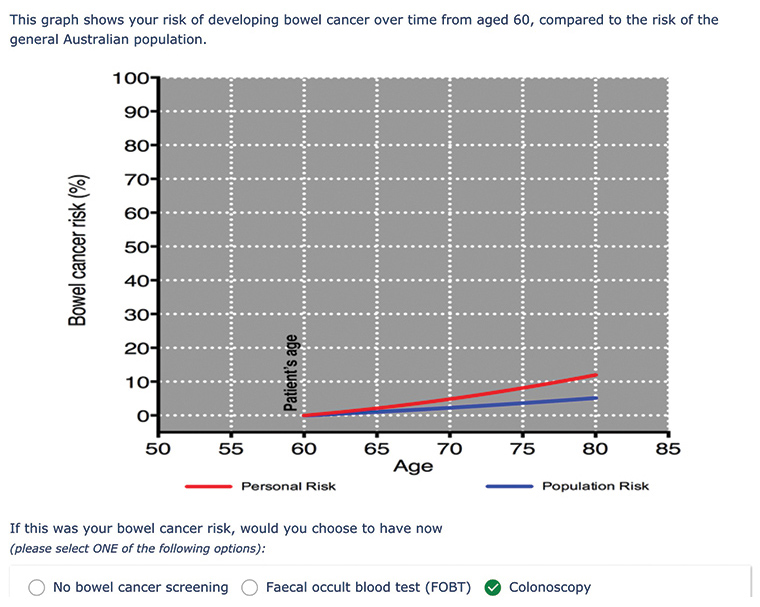
Figure 2. Risk format 5 – Line graph showing absolute risk over lifetime, compared with the population (for increased risk)
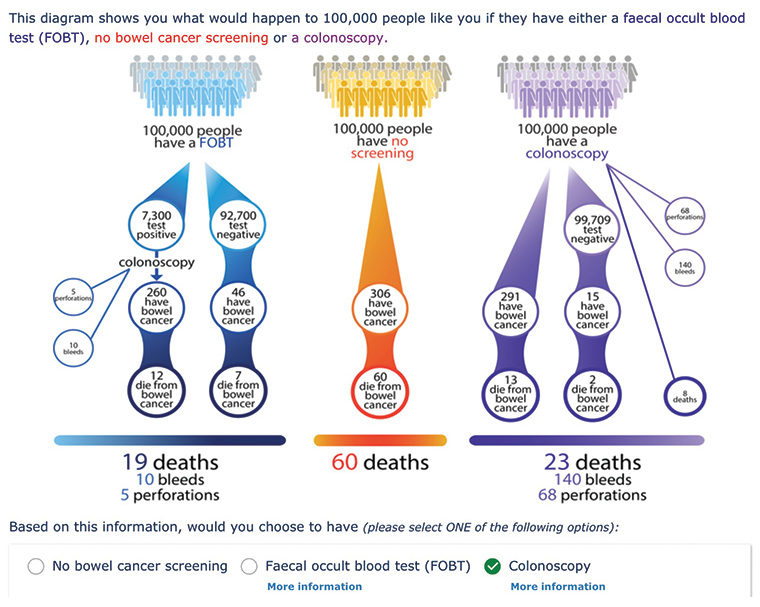
Figure 3. Risk format 3 – Expected frequency tree (for average risk)
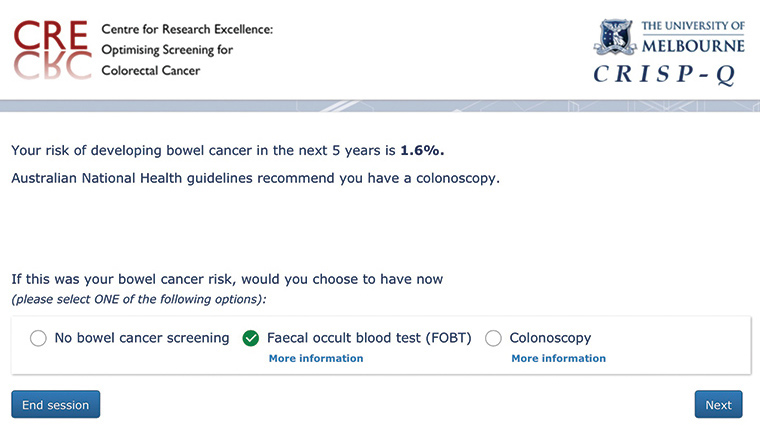
Figure 4. Risk format 4 – Absolute risk statement with government recommendation (for increased risk)
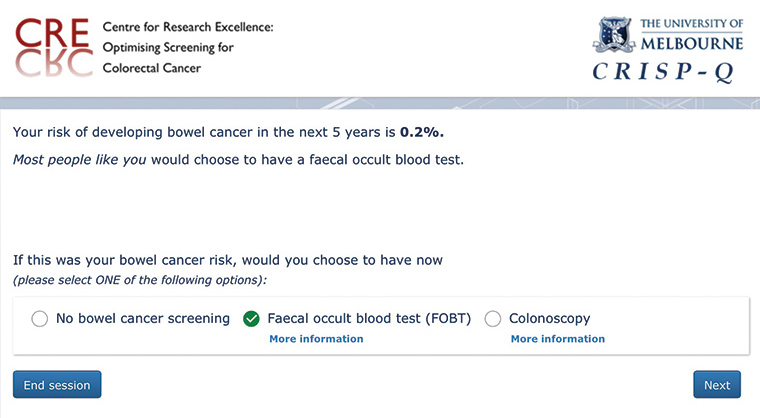
Figure 5. Risk format 2 – Absolute risk statement with recommendation based on social norms (for average risk)
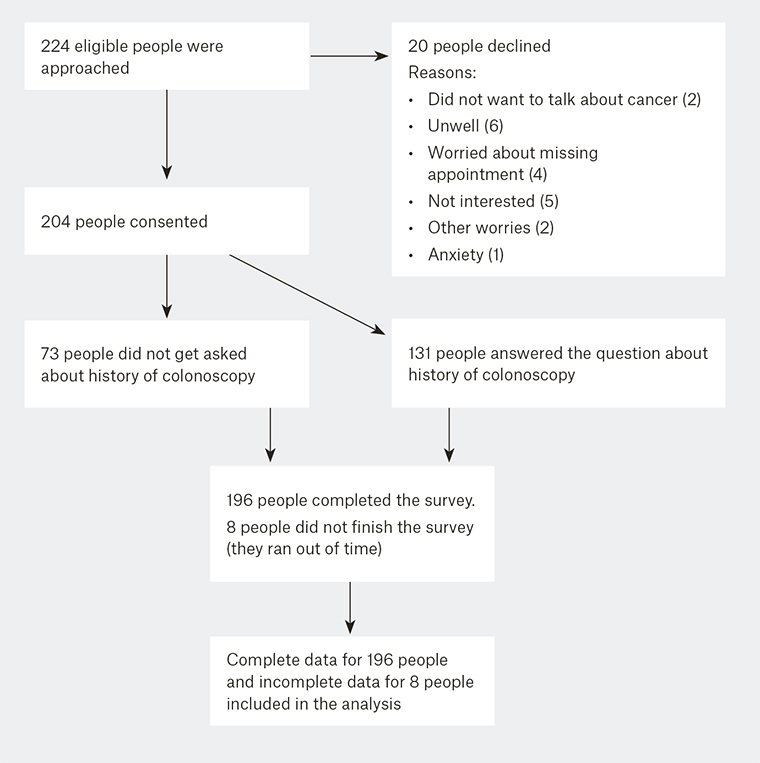
Figure 6. Number of individuals at each stage of the study
Participants were asked to imagine that the information presented was about them and to choose their preferred screening option (no screening, FOBT, or colonoscopy). Participants were shown up to ten risk presentations, which were delivered in a random order to reduce potential learning effects, via a software application running on an Apple iPad. We also collected non-identifiable information about participant characteristics, such as age, gender, ethnicity, relationship status, education level and previous history of colonoscopy.
The vignettes were designed to take no more than ten minutes to complete. The researcher collected extensive field notes, including observations within the clinic, to provide any qualitative information relevant to the results.
Statistical analysis
In addition to descriptive analysis, we used multivariable logistic regression to examine associations between risk format and risk-appropriate screening. Appropriate screening choice was defined as FOBT for average risk and colonoscopy for increased risk as per NHMRC guidelines. The explanatory variables included risk format, risk level, age (as a continuous variable), gender, ethnicity (born in Australia or ‘other’), relationship status, education and previous history of colonoscopy. As a secondary analysis, we split the dataset and developed separate models for each risk level.
Part way through recruitment, we decided to add in a question about previous history of colonoscopy, to explore if people who had previously had colonoscopies were more likely to choose colonoscopy as their choice of screening method. Because history of colonoscopy data were missing for a random subset of the sample, we analysed the data in the same way as the other variables. We adjusted for clustering due to multiple data points per participant using robust standard errors.29 The responses were recorded in Microsoft Excel and analysed using Statacorp STATA 13.1.29
Results
Between February and April 2016, we recruited 204 individuals; 20 individuals declined to participate (91% accrual rate; Figure 6, available online only). The mean age of participants was 61.7 years. The sample was relatively highly educated, with a high rate of colonoscopy use (Table 1). History of colonoscopy data were missing for 36% of participants.
| Table 1. Summary of participant characteristics (n = 204) |
| |
Participants n (%) |
Age (years)
40–49
50–59
60–69
≥70 |
37 (18%)
38 (19%)
87 (43%)
42 (20%)
|
Gender
Male
Female |
65 (32%)
139 (68%)
|
Ethnicity
Australian
Other |
163 (80%)
41 (20%)
|
Relationship status
In a relationship
Separated/divorced
Single
Widowed |
152 (74%)
16 (8%)
26 (13%)
10 (5%)
|
Education level
University degree or higher
TAFE qualification or similar
Completed high school only
Never completed high school |
125 (61%)
28 (14%)
37 (18%)
14 (7%)
|
Previous colonoscopy
Yes
No
Missing |
84 (41%)
47 (23%)
73 (36%)
|
Overall, the study showed that all risk formats were associated with increased likelihood of opting for appropriate screening, compared with not giving any information about risk. The AR statement with government recommendation, EFT, line graph and AR statement with social norm statement were associated overall with a significantly higher odds of appropriate screening than the icon array (Table 2). The point estimates of the odds ratios were highest for the AR statement with government recommendation but there were no statistically significant differences between the other formats. We found no statistically significant association between risk level and appropriate screening choice.
| Table 2. Predictors of appropriate screening |
| |
Total |
Average risk |
Increased risk |
| Predictor variable |
OR (95% CI) |
P |
OR (95% CI) |
P |
OR (95% CI) |
P |
Risk format
Icon array
Government recommendations
EFT
Line graph
Social norms |
Ref
1.69 (1.35–2.12)
1.50 (1.16–1.94)
1.43 (1.15–1.78)
1.41 (1.18–1.68) |
0.0001
..
..
..
|
Ref
2.02 (1.43–2.86)
1.86 (1.23–2.83)
1.61 (1.15–2.25)
1.44 (0.98–2.11) |
0.0016
..
..
..
|
Ref
1.64 (1.12–2.40)
1.58 (1.12–2.23)
1.37 (1.05–1.79)
1.37 (0.94–2.00) |
0.032
..
..
..
|
Risk level
Average risk
Increased risk |
Ref
0.88 (0.53–1.49) |
0.64
|
|
|
|
|
| Age |
1.01 (0.99–1.02) |
0.30 |
1.02 (0.99–1.05) |
0.23 |
1.00 (0.97–1.03) |
0.81 |
Gender
Female
Male |
Ref
0.98 (0.77–1.26) |
0.90
|
Ref
0.48 (0.25–0.91) |
0.024
|
Ref
2.00 (1.06–3.77) |
0.033
|
Ethnicity
Australian
Other |
Ref
1.11 (0.84–1.46) |
0.45
|
Ref
0.74 (0.37–1.52) |
0.41
|
Ref
1.71 (0.79–3.68) |
0.17
|
Relationship status
In a relationship
Separated/divorced
Single
Widowed |
Ref
1.05 (0.72–1.54)
1.44 (0.97–2.15)
0.78 (0.49–1.26) |
0.19
..
..
|
Ref
2.20 (0.71–6.82)
3.04 (1.11–8.35)
1.42 (0.38–5.40) |
0.11
..
..
|
Ref
0.59 (0.21–1.69)
0.80 (0.35–1.81)
0.39 (0.11–1.35) |
0.11
..
..
|
Education level
Uni degree or higher
Other |
Ref
1.31 (1.02–1.69) |
0.03
|
Ref
0.90 (0.48–1.70) |
0.75
|
Ref
2.06 (1.08–3.94) |
0.029
|
Previous colonoscopy
No
Yes |
Ref
0.92 (0.70–1.19) |
0.51
|
Ref
0.22 (0.11–0.42) |
<0.001
|
Ref
3.49 (1.82–6.70) |
<0.001
|
| CI, confidence interval; EFT, expected frequency tree; OR, odds ratio |
A lower level of education was associated with appropriate screening (odds ratio [OR] 1.31, 95% confidence interval [CI] 1.02, 1.69; P = 0.03). In the ‘average risk’ subgroup, being male and having a history of previous colonoscopy were each associated with a reduced likelihood of making the appropriate screening choice (Table 2). In the average risk group, both AR statements and the EFT overall were associated with a significantly higher odds of appropriate screening, compared with the icon array (P <0.01), but there was no difference between the line graph and icon array (P = 0.061). Notably, the average risk EFT led to the lowest number of people choosing ‘no screening’ (ie only four people chose no screening when they saw the EFT, as opposed to 37 with the icon array).
In the ‘increased risk’ subgroup, being male and less educated each increased the likelihood of choosing the appropriate screening method by a factor of two, and having a previous history of colonoscopy increased the likelihood of choosing the appropriate screening method threefold (Table 2). The AR statement with government recommendation, graph and AR statement with recommendation based on social norms were better than the icon array (P <0.03), but the EFT was not significantly different from the icon array (P = 0.10).
Discussion
This study provides insight into different formats to communicate risk and their associations with risk-appropriate screening choices for CRC. We observed that patients in primary care were more likely to make the appropriate screening choice when they were shown an AR statement and the associated government recommendation. The icon array was most weakly associated with risk-appropriate screening.
Influencing human behaviour is very difficult and often requires complex interventions.16 Contrary to previous literature and data suggesting that social norms are more effective for influencing behaviour,25 we found that more people opted for the appropriate screening when they were shown the AR statement with national health guidelines rather than with a social norm statement. This finding could be because people trust the NHMRC as an independent source of expert and legitimate information. This result supports the importance of government/national health guidelines on improving the rates of appropriate screening and suggests that current government messages about CRC screening may not be effectively reaching the public.
Previous studies have found that visual displays are better at improving people’s understanding of risk information than pure numbers because they are better at gaining people’s attention, can summarise the key message, explain complicated concepts in a concise way, and are helpful for those with low numeracy and literacy skills.10,14–16 Although icon arrarys are widely used in current risk communication tools, our findings showed that they were least effective in getting people to make appropriate screening choices. In this study, the icon array for average risk led to the greatest number of people choosing ‘no screening’. This finding is consistent with previous work showing that icon arrays, when used in decision tools for rare events, tend to make people feel that they are at such low risk of the condition that they opt for no screening.10
In relation to cancer screening, there has been a gradual push to implement the use of EFTs as they are a simple way of presenting multiple conditional probabilities.12 In agreement with previous studies,12 we have found that the EFT for average risk was strongly associated with appropriate CRC screening. This format emphasises the risks of colonoscopy and the benefits of FOBT screening, suggesting a potential role in reducing the rate of unnecessary colonoscopies in those at average risk of CRC.
The comparative line graph was strongly associated with appropriate screening in the increased risk group. This finding is consistent with Spiegelhalter’s findings that people felt some reassurance learning their risk of cancer is below average for their age.16 A clear demonstration that one’s risk is greater than expected for one’s age may be sufficient to promote use of colonoscopy.
Strengths and limitations of this study
The high recruitment rate of 91% minimised any sample selection bias. However, recruitment in a single general practice that included patients who were, on average, well educated, may limit the generalisability of our findings. The order of vignettes and risk formats was presented randomly to reduce potential learning effects, but a much larger study would be required with ten different scenarios to fully balance any ordering effects. Although vignette responses are useful indicators of people’s screening intentions, they may not accurately reflect people’s actual screening behaviour.30
Conclusions and implications for general practice
We have found that the AR statement with national health guidelines has the greatest association with appropriate screening decisions across both risk groups. The findings have implications for designers of tools and decision aids that present information about disease risk and outcomes of different screening tests. We have applied our results to the development of the CRISP risk assessment tool for CRC, which is currently being tested in a randomised controlled trial in Australian general practice. Evidence suggests that GPs and their recommendations consistently improve participation in screening for CRC. The EFTs we have developed, which outline the relative benefits and harms of different screening options for CRC, may be useful for GPs to facilitate a discussion in those at average risk of CRC who want a colonoscopy. If more patients can be engaged in a discussion with their GP about CRC risk, and the risks and benefits of different screening methods, a more effective implementation of risk‑approriate CRC screening could result.