Continuity of care refers to care extending beyond a single episode of illness and is a core component of high-quality primary care.1,2 Dimensions of continuity of care include relational continuity, which refers to the therapeutic relationship between patients and health providers, and informational continuity, which considers the transfer of information supporting safe, high-quality care.3
In Australia, patients may consult multiple general practitioners (GPs) and general practices. While unrestricted access to general practice services is seen to encourage choice and competition, it has been criticised for facilitating fragmented or unnecessary care.4,5 In other countries, patients enrol with either a single general practitioner (as in the Netherlands) or with a single general practice (as in the United Kingdom), and alternative care is restricted, thus enforcing continuity of care.6 The Australian Health Care Home Program includes a trial of voluntary practice enrolment7 and aims to improve continuity of care for people with chronic and complex conditions4 – the patient group thought most likely to benefit from continuity of care.8–10
This research examines the extent to which continuity of care around a general practice (site continuity of care) is obtained, as evidenced by patients’ reported use of single or multiple general practices. Attendance at multiple general practices potentially reduces relational continuity between patients and their GPs, as well as reducing informational continuity (as Australian general practices do not routinely share consultation information).
Context
Nearly 83% of Australian residents have at least one consultation with a GP annually,11 averaging 6.8 visits.12 Most Australians report having a regular GP,11,13 and have strong preferences for seeing a GP who knows them.14,15 However, consultations with multiple GPs are common,5 and previous research suggests that patients who attend multiple general practices are more likely to be younger, female, have a higher education attainment, and are more frequent users of health services5,16 than single general practice attenders.
There is limited research examining multiple practice attendance in Australia and little is known about the characteristics of multiple practice attenders. An analysis by Britt et al (2014) of 7799 adults attending general practices reported that 7.8% of patients identified having a regular practice other than the one they were currently attending.17 However, Medicare statistics do not provide data about multiple practice attendance. In this research, a survey of Australian adults was used to estimate the prevalence of multiple practice attendance and characteristics of multiple practice attenders.
Methods
This study analyses data from an online survey of 2477 Australian adults that focused on healthcare attitudes and behaviour. It was administered in July 2013, as part of a primary care research program approved by the Human Research Ethics Committee at the University of Technology Sydney. The survey has been described previously,18 and publications have reported results relating to bulk-billing rates, preferences for care and the quality of general practice services.14,18,19
The key variable of interest for this study was whether respondents reported attending more than one general practice in the previous 12 months. Explanatory variables relate to respondents’ perceptions of having a usual GP and a usual general practice, together with patient demographic, health service use and general practice characteristics reported in previous Australian primary care research.13 All included variables are summarised and described in Table 1, together with summary statistics and comparisons of survey demographics with the Australian population.
Bivariate analysis (using chi-square tests) was used to assess associations between multiple practice attendance and respondent and practice characteristics. Logistic regression models were analysed, with multiple practice attendance as the binary dependent variable, using Stata version 14. After excluding respondents with fewer than two GP visits, and those with missing data, 1274 responses were included in the logistic regression (Table 2). Statistical significance was set at P <0.05.
| Table 1. Variables used with analysis, summary statistics and comparison with Australian Bureau of Statistics (ABS) population statistics20–22,23 |
| Variable name |
Variable definition |
n |
Sample
proportion (SD) |
ABS
comparison1 |
| Practice use |
|
|
|
|
| Multiple practices |
1 = attended more than one practice in previous 12 months; 0 = otherwise |
2,477 |
0.28 (0.45) |
NA |
| Usual practice |
1 = usually attend the same general practice; 0 = No |
2,477 |
0.90 (0.3) |
NA |
| Usual GP |
1 = usually see same GP at practice; 0 = No |
2,477 |
0.80 (0.4) |
NA |
| Age (years) |
|
2,471 |
|
|
| <30* |
1 = 16–29 years of age; 0 = otherwise |
|
0.15 (0.36) |
0.25 |
| 30–39 |
1 = 30–39 years of age; 0 = otherwise |
|
0.23 (0.42) |
0.16 |
| 40–49 |
1 = 40–49 years of age; 0 = otherwise |
|
0.21 (0.41) |
0.18 |
| 50–59 |
1 = 50–59 years of age; 0 = otherwise |
|
0.19 (0.39) |
0.15 |
| 60–69 |
1 = 60–69 years of age; 0 = otherwise |
|
0.16 (0.37) |
0.13 |
| ≥70 |
1 = ≥70 years; 0 = otherwise |
|
0.06 (0.24) |
0.11 |
| Gender |
1 = female; 0 = male |
2,463 |
0.52 (0.5) |
0.51 |
| Country of birth |
1 = Australian born; 0 = born in another country |
2,471 |
0.73 (0.44) |
0.72 |
| Married/de facto |
1 = married or living with de facto; 0 = other marital status (single, widowed, divorced, separated) |
2,424 |
0.52 (0.50) |
|
| Place of residence2 |
|
2,357 |
|
|
| Major city* |
1 = living in major metropolitan city |
|
0.77 (0.42) |
0.63 |
| Inner regional |
1 = living in inner regional location |
|
0.15 (0.36) |
0.2 |
| Outer regional |
1 = living in outer regional location |
|
0.07 (0.25) |
0.17 |
| Remote |
1 = living in remote location |
|
0.01 (0.07) |
|
| Highest educational attainment |
|
2,444 |
|
|
| Less than HSC |
1 = did not complete HSC |
|
0.15 (0.35) |
0.25 |
| HSC |
1 = HSC completion, without further qualification |
|
0.17 (0.38) |
0.18 |
| Certificate/diploma |
1 = has post–high school qualification (eg TAFE) |
|
0.32 (0.47) |
0.31 |
| University graduate* |
1 = has university degree or higher |
|
0.36 (0.48) |
0.23 |
| Income status |
|
2,115 |
|
|
| Low |
1 = total household income less than $40,000 |
|
0.29 (0.45) |
0.26 |
| Medium |
1 = total household income between $40,000 and $79,900 |
|
0.29 (0.46) |
0.27 |
| High |
1 = total household income between $80,000 and $149,900 |
|
0.32 (0.47) |
0.29 |
| Very high* |
1 = total household income greater than $149,900 |
|
0.1 (0.29) |
0.18 |
| Employed |
1 = employed (part time or full time); 0 = other (student, retired, not working) |
2,386 |
0.81 (0.39) |
|
| Concession card holder |
1 = has a Health Care Card, Pensioner Concession Card, Seniors Card or Department of Veterans' Affairs card;
0 = no concession card |
2,473 |
0.46 (0.5) |
|
| Private health insurance |
1 = has private hospital health insurance |
2,295 |
0.55(0.5) |
0.47 |
| Self-assessed health |
|
2,477 |
|
|
| Excellent* |
1 = excellent health; 0 = otherwise |
|
0.08 (0.28) |
0.19 |
| Very good |
1 = very good health; 0 = otherwise |
|
0.34 (0.47) |
0.36 |
| Good |
1 = good health; 0 = otherwise |
|
0.38 (0.48) |
0.3 |
| Fair |
1 = fair health; 0 = otherwise |
|
0.15 (0.36) |
0.11 |
| Poor |
1 = poor health; 0 = otherwise |
|
0.05 (0.21) |
0.04 |
| Chronic disease sufferer |
1 = if yes for any of list of chronic diseases;3
0 = no for all chronic diseases |
2,477 |
0.6 (0.49) |
0.5 |
| Smoker |
1 = current smoker; 0 = non-smoker or ex-smoker |
2,257 |
0.23 (0.42) |
0.15 |
| GP visits in the previous year |
|
2,477 |
|
|
| 0 |
1 = no GP visits in previous 12 months |
|
0.07 (0.26) |
0.15 |
| 1 |
1 = 1 GP visits in previous 12 months |
|
0.15 (0.36) |
0.14 |
| 2–3* |
1 = 2 or 3 GP visits in previous 12 months |
|
0.41 (0.49) |
0.32 |
| 4–11 |
1 = 4–11 GP visits in previous 12 months |
|
0.3 (0.46) |
0.29 |
| ≥12 |
1 = 12 or more GP visits in previous 12 months |
|
0.06 (0.24) |
0.12 |
| Emergency department user in the previous 12 months |
1 = attended emergency department (ED) in last 12 months;
0 = no ED attendances |
2,477 |
0.19 (0.39) |
0.14 |
| Home visits |
1 = had home visit from GP in last 12 months; 0 = otherwise |
2,477 |
|
|
| Number of GPs in practice4 |
|
2,197 |
|
|
| 1 or 2* |
1 = 1 or 2 GPs in practice |
|
0.22 (0.41) |
NA |
| 3–5 |
1 = 3–5 GPs in practice |
|
0.4 (0.49) |
|
| 6–10 |
1 = 6–10 GPs in practice |
|
0.3 (0.46) |
|
| >10 |
1 = more than 10 GPs in practice |
|
0.09 (0.28) |
|
| Practice has bulk billing |
1 = practice offers bulk billing always or sometimes;
0 = no bulk billing offered at practice |
2,351 |
0.88 (0.33) |
|
*Base case in logistic regression analysis for categorical variables
12011 census provides age band of 15–29 years; 2Place of residence based on five ARIA groupings (Australian Statistical Geography Standard Remoteness Structure, 2011). ARIA 4 and 5 (remote and very remote) grouped together due to low sample size; 3List of chronic diseases asthma, cancer, chronic obstructive pulmonary disease, chronic pain, depression or another mood disorder, diabetes, heart disease, high blood pressure or other chronic disease; 4For practice characteristics, 'don't know' was a response option. Don’t know respondents were coded as missing (and omitted) in logistic regression, and included within sensitivity analysis within most common category
GP, general practitioner; HSC, Higher School Certificate; NA, no available data; SD, standard deviation |
Results
Sample characteristics
Most respondents were aged under 50 years of age (59%), with 6% being over 70 years of age. Most respondents were Australian born (79%), lived in major cities (77%), were employed (81%) and had private health insurance (55%). The majority of respondents rated their health as good or better (80%), although 60% reported having one or more chronic health conditions.
Over 93% of respondents reported attending a general practice in the previous 12 months; most respondents reported either 2–3 visits (40%) or 4–11 visits (31%) in the previous years. Most respondents attended a practice with four or more GPs (79%); 9% attended a practice that has more than 10 GPs. Most respondents reported having a usual GP (80%) and over 90% of respondents reported having a usual general practice.
The demographic profile of the sample was comparable to the Australian population in terms of gender, but was under-represented in the youngest (16–24 years) and oldest (75 years and over) age groups, compared with Australian Bureau of Statistics data.20 Compared with the Australian population, the sample had a smaller proportion of survey respondents reporting excellent health, and included a smaller proportion of non–general practice attenders and high–general practice attenders (12 or more visits in a year).5
As shown in Table 1, 28% of the total number (2477) of survey respondents reported attending more than one general practice in the previous 12 months. After excluding respondents with fewer than two GP visits (22% of sample), 610 of the remaining 1920 respondents (31.8%) reported attending multiple general practices in the last 12 months.
Does having a usual GP or practice affect multiple practice attendance?
Of single-practice users, 86.9% identified both a usual GP and usual practice, compared with 84.7% of multiple-practice users. A higher proportion of multiple-practice users reported not having a usual practice (21.0%), compared with single-practice users (1.93%), and this difference is statistically significant (Table 2).
86.1% of single practice users and 80.3% of multiple practice users reported having a usual GP. There was no statistically significant difference between single and multiple practice users in terms of having a usual GP (odds ratio [OR]: 1.14; 95% confidence intervals [CI]: 0.76, 1.75). This result appears consistent with patients’ preferences for having a usual GP being unaffected by attendance at multiple practices.
| Table 2. Association between multiple general practice attendance and explanatory variables |
| Variable |
Bivariate analysis |
Logistic regression |
| |
Proportion of multiple practice attenders in category |
Chi2 (P) |
Odds ratio of multiple practice attendance (standard error) |
95% confidence intervals |
| Practice usage |
|
|
|
|
| Usual practice |
0.243 |
118.400 (P <0.001)* |
0.0585 (0.0200)* |
0.030, 0.114 |
| Usual general practitioner |
0.274 |
0.351 (P = 0.554) |
1.141 (0.245) |
0.750, 1.737 |
| Age (years) |
|
117 (<0.001)* |
|
|
| <30§ |
0.422 |
|
1 |
0.520, 1.308 |
| 30–39 |
0.372 |
|
0.825 (0.194) |
0.381, 0.992 |
| 40–49 |
0.247 |
|
0.614 (0.150)‡ |
0.239, 0.673 |
| 50–59 |
0.216 |
|
0.401 (0.106)* |
0.206, 0.647 |
| 60–69 |
0.166 |
|
0.365 (0.107)* |
0.171, 0.751 |
| ≥70 |
0.129 |
|
0.359 (0.135)† |
0.520, 1.308 |
| Female |
0.306 |
11.780 (P = 0.001)† |
1.237 (0.18) |
0.930, 1.645 |
| Australian born |
0.272 |
0.610 (P = 0.435) |
0.950 (0.154) |
0.691, 1.305 |
| Married/de facto |
0.263 |
2.300 (P = 0.128) |
0.900 (0.136) |
|
| Place of residence |
|
34.000 (P <0.001)* |
|
|
| Major city§ |
0.300 |
|
1.000 |
|
| Inner regional |
0.161 |
|
0.618 (0.127)‡ |
0.413, 0.925 |
| Outer regional |
0.200 |
|
0.479 (0.16)‡ |
0.248, 0.924 |
| Remote |
0.310 |
|
1.231 (0.96) |
0.267, 5.679 |
| Highest educational attainment |
|
26.810 (P <0.001)* |
|
|
Less than Higher School Certificate |
0.219 |
|
1.019 (0.235) |
0.648, 1.601 |
| Higher School Certificate |
0.230 |
|
0.638 (0.137)‡ |
0.419, 0.972 |
| Certificate/diploma |
0.257 |
|
0.861 (0.152) |
0.609, 1.216 |
| University graduate§ |
0.335 |
|
1.000 |
|
| Income status |
|
18.200 (P <0.001)* |
|
|
| Low |
0.230 |
|
0.703 (0.214) |
0.386, 1.278 |
| Medium |
0.267 |
|
0.759 (0.200) |
0.453,1.272 |
| High |
0.328 |
|
0.921 (0.222) |
0.574,1.478 |
| Very high§ |
0.330 |
|
1 |
|
| Employed |
0.267 |
4.61 (P = O.032)‡ |
1.255 (0.243) |
0.859, 1.835 |
| Concession card holder |
0.253 |
5.91 (P = 0.015)‡ |
0.814 (0.149) |
0.568, 1.166 |
| Private health insurance |
0.288 |
3.75 (P = 0.053) |
1.046 (0.162) |
0.772, 1.416 |
| Self-assessed health |
|
4.68 (P = 0.322) |
|
|
| Excellent§ |
0.325 |
|
1 |
|
| Very good |
0.281 |
|
1.243 (0.395) |
[0.666,2.318] |
| Good |
0.27 |
|
1.227(0.393) |
[0.654,2.300] |
| Fair |
0.247 |
|
0.986 (0.351) |
0.491, 1.983 |
| Poor |
0.298 |
|
1.338 (0.582) |
0.570, 3.139 |
| Chronic disease |
0.6 (0.49) |
0.04 (P = 0.847) |
1.117 (0.187) |
0.804, 1.551 |
| Smoker |
0.23 (0.42) |
5.90 (P = 0.015)‡ |
1.160 (0.196) |
0.833, 1.615 |
| GP visits in previous year|| |
|
84.7 (P <0.001)* |
|
|
| 0 |
0.04 |
|
- |
|
| 1 |
0.175 |
|
- |
|
| 2–3§ |
0.317 |
|
1 |
|
| 4–11 |
0.317 |
|
1.126 (0.171) |
0.836, 1.518 |
| ≥12 |
0.327 |
|
1.211 (0.333) |
0.706, 2.077 |
| Emergency department user last 12 months |
0.394 |
39.4 (P <0.001)* |
1.564 (0.264)† |
1.124, 2.177 |
| Home visits |
0.5 |
56.9 (P <0.001)* |
1.742 (0.419)‡ |
1.087, 2.790 |
| Number of GPs in practice |
0.228 |
2.19 (P = 0.53) |
|
|
| 1 or 2 GPs§ |
0.408 |
|
1 |
|
| 3–5 GPs |
0.282 |
|
0.969 (0.180) |
0.674, 1.394 |
| 6–10 GPs |
0.08 |
|
0.660 (0.133)‡ |
0.445, 0.978 |
| More than 10 GPs |
0.228 |
|
0.558 (0.156)‡ |
0.323, 0.967 |
| Practice has bulk billing |
0.28 |
0.210 (P = 0.643) |
0.753 (0.175) |
0.477, 1.189 |
Logistic regression (n = 1274) results are reported in odds ratios (ORs) with an OR >1 indicating increased odds of multiple practice attendance.
Logistic regression statistics: Pseudo R2: 0.1526; LR chi2: 239.76; Prob >chi2: 1403.3; AIC: 1588.7
*P <0.001; †P <0.01; ‡P <0.05; §Indicates base case in logistic regression analysis for categorical variables; ||Respondents reporting 0 and 1 visits in previous year were omitted from analysis as illogical to being multiple general practice attenders with <2 visits
AIC, Aikake information criterion; LR, likelihood ratio |
The influences of patient demographic characteristics
There was a strong trend for older respondents to attend only one general practice. While 42% of those aged under 30 years reported attending multiple practices, only 12.9% of respondents aged over 70 years reported doing so (P <0.01). This association is shown in Figure 1. When other patient sociodemographic, health and practice variables were controlled for, older age was associated with significantly reduced odds of attending multiple general practices. Compared with an individual aged under 30 years, respondents aged 60–69 years had an OR of 0.34 of being a multiple practice attender (95% CI: 0.20, 0.59).
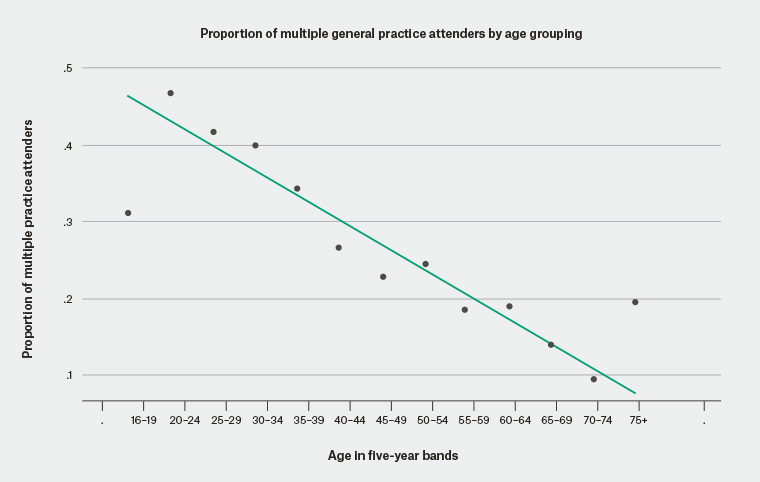
Figure 1. Scatterplot of association between increasing age and decreasing multiple practice attendance and trend line
Respondents living in metropolitan areas had greater odds of multiple practice attendance, compared with respondents from inner regional (OR: 0.60, 95% CI: 0.40, 0.89) and outer regional locations (OR: 0.48; 95% CI: 0.25, 0.92). This potentially reflects lower availability of alternative general practices in non-metropolitan areas. Compared with university graduates, the odds of multiple practice attendance was decreased in respondents with lower educational attainment, although this was only significant for those who had completed their high school education without further study (OR 0.64; 95% CI: 0.42, 0.97).
While bivariate analysis suggests greater rates of multiple practice attendance by women and significant differences relating to income, these differences were not significant after controlling for other variables in the logistic regression. No statistically significant differences relating to country of birth, employment status, private health insurance status, concession card status, country of birth, or health status (either self-reported or presence of chronic disease) were found in the logistic regression.
Health service use and practice characteristics
Respondents who reported attending an emergency department in the previous 12 months had significantly increased odds of being a multiple practice user (OR: 1.56; 95% CI: 1.12, 2.17), as were those people who reported home visits (OR: 1.77; 95% CI: 1.11, 2.82). There was no significant association between reporting a higher number of GP visits and multiple practice attendance. This finding differs from previous research suggesting that there was a relationship between seeing multiple GPs and higher numbers of GP visits,5 and suggests there may be different drivers for multiple GP and multiple practice attendance.
Compared with respondents attending practices with one or two doctors, there was a statistically significant decrease in the odds of multiple practice attendance for respondents whose practices had 6–10 doctors (OR: 0.65; 95% CI: 0.44, 0.96) or 10 or more doctors (OR: 0.55; 95% CI: 0.32, 0.96). This may be evidence that larger practices are better able to manage the needs of their patient population. Single and multiple practice users were just as likely to report having a usual practice that offered bulk billing.
Discussion
Survey respondents reported high levels of site continuity in the absence of practice enrolment, but a significant proportion also reported multiple practice use; more than one-quarter of respondents reported attending more than one practice in the previous year. These are higher rates of multiple practice attendance than have been reported previously,13,17 and suggest that a substantial portion of general practice care is provided away from a patient’s usual practice.
The finding that single and multiple practice users were equally likely to identify a usual GP could indicate that attendance at multiple practices does not reduce patients’ perception that they have a usual GP. Patients are known to be more likely to attend a non-usual practice if they perceive that their reason for attendance is simple, or non-urgent, if they are away from their usual practice, or if they cannot access an appointment when needed.21 The finding that there is no significant association between multiple practice use and bulk billing is consistent with patients attending multiple practices to improve their access to care, rather than to reduce costs. The clinical content of consultations is not reported in this survey and further research is needed to fully understand the reasons for multiple practice attendance.
These results also show that the characteristics of multiple GP attenders reported in previous research13,16 and those of multiple practice users are similar, including being younger and more highly educated than single practice/GP users. However, an association between increased numbers of GP visits and multiple GP attendance reported in previous research5 did not extend to multiple practice use. Attending another practice – when care from the usual practice is unavailable – potentially acts as a substitute for usual GP care rather than increasing health service use. However, the association between increased rates of emergency department attendance and home visits and multiple practice use suggest that single and multiple practice users may have different patterns of health service use.
In Australia, the usual GP does not receive information about any ‘non-usual’ practice attendance, if not volunteered by the patient subsequently. Without such information sharing between practices, informational continuity will be reduced and potentially lead to worse health outcomes if important information is not passed on. The finding that multiple practice use is most common in the youngest age groups (anticipated to have lower burden of disease) potentially means this information loss and suggested sequelae is inconsequential, but this assumption needs testing.
Limitations of this research include possible selection bias as a result of using an online sample and the under-representation of older Australians among the survey respondents; the potential for recall bias in using self-reports of health status and health service use; and the absence of clinical content that might explain reasons for multiple practice attendance.
Conclusion
Results from this survey suggest that Australian patients frequently seek care from multiple general practices. Multiple practice attendance is more common in younger patients and those with higher education. These findings suggest that most Australians have a usual practice and a usual GP and that multiple practice attenders are as likely as single practice users to report having a usual GP. While policy interventions to reduce multiple practice attendance may improve continuity of care, they may potentially reduce patient choice.