Chronic kidney disease (CKD) affects approximately 10% of adult Australians.1 CKD is associated with significantly increased risk of cardiovascular disease (CVD) and cardiovascular (CV) death.2 The risk of dying from CVD is up to 20 times greater in patients with CKD than the risk of requiring dialysis or transplantation.3
Hypertension frequently co-exists with CKD;4 its prevalence rises with advancing CKD stage, alongside blood pressure (BP) becoming more difficult to control.5 Hypertension is a common cause of end-stage renal disease (ESRD) and is associated with more rapid progression of CKD.2,6,7 Hypertension is therefore an important therapeutic target in the management of CKD; lowering elevated BP is an effective strategy to both reduce the risk of CV events and slow progression of CKD.8–10 Kidney Health Australia11 and the National Heart Foundation of Australia12 provide guidelines to manage BP and indicate target levels in patients with CKD, according to the presence or absence of specific high-risk clinical factors (≤130/80 mmHg for patients with concomitant diabetes, CVD or albuminuria; ≤140/90 mmHg for others).
Factors contributing towards BP control relate to patients, doctors and health systems.13 Continuity of care (CoC) is a widely accepted core principle of primary care,14 and is an important component of high-quality healthcare as it spans all the factors contributing to BP control. Better awareness of hypertension and adherence to medication by patients has been reported with higher CoC;15 it has also been shown to result in reduced hospitalisation risks, emergency department visits and healthcare costs for several chronic diseases.16 CKD and hypertension are common chronic diseases and are routinely managed in primary care.17,18 Hence, it is worth looking at the association of CoC with BP control in Australian general practice patients with CKD and concomitant hypertension. The aim of this study was therefore to investigate the control of BP, according to guideline-recommended targets, in adults with CKD and hypertension, and to evaluate factors related to BP control, particularly continuity of general practice care.
Methods
MedicineInsight, developed and managed by NPS MedicineWise, is a large-scale national data program in Australia to extract and collate longitudinal, whole-of-practice data from the clinical information systems of consenting general practices. MedicineInsight collects de-identified patient data, including demographics, encounters (not including progress notes), diagnoses, prescriptions and pathology tests. At July 2017, MedicineInsight had recruited over 650 general practices, giving information from more than 3300 general practitioners (GPs) and 3.6 million patients.19
Participants
We used MedicineInsight data from 1 January 2013 to 1 June 2016 collected from 329 general practices located throughout Australia. Patients were initially included if at the time of data extract they were aged at least 18 years, met The Royal Australian College of General Practitioners’ (RACGP’s) definition of an ‘active’ patient (at least three consultations with a GP at the same general practice within a two-year period) and could be diagnosed with CKD by a GP on the basis of their laboratory pathology results (having two or more estimated globular filtration rate [eGFR] values <60 mL/min/1.73m2, and/or two urinary albumin-to-creatinine ratios (ACRs) ≥3.5 mg/mmol in females or ≥2.5 mg/mmol in males, at least 90 days apart).11
Variables
We considered age group, sex, rurality, Aboriginal and/or Torres Strait Islander status and socioeconomic index as sociodemographic indicators, and ACR and eGFR as laboratory variables. Rurality was based on Australian Bureau of Statistics’ Australian Statistical Geography Standard Remoteness Areas20 and assigned according to the postcode of the patient’s residence. The remoteness classification divides each state and territory into several regions on the basis of their relative access to services. Socioeconomic index was also based on patient postcode, using the Socio-Economic Indexes for Areas (SEIFA) of relative socioeconomic advantage and disadvantage decile. SEIFA is ranked from 1 (most disadvantaged area) to 10 (most advantaged).21
We also analysed each patient’s comorbidities, documentation of a diagnosis of CKD, number of visits with a GP and their relational CoC with a particular GP. Documentation of the diagnosis of CKD was extracted from condition codes and manual searches (including terms such as ‘chronic renal disease’ and ‘chronic renal impairment’) conducted on ‘free-text’ or narrative information in the past medical history, reason for encounter and reason for prescription data fields. The comorbidities examined were based on ‘condition flags’ provided by MedicineInsight, using an algorithm that analyses coded and free-text patient information. We examined only hypertension, diabetes, CVD, anxiety and atrial fibrillation as comorbidities, as these each had a prevalence above 10%. The diagnoses of CVD (myocardial infarction, heart failure, coronary artery bypass graft, transient ischaemic attack and stroke) were provided by MedicineInsight using methods described in their data book.22
A total of 61,102 patients had laboratory evidence of CKD within the study period. We identified 51,242 (83.9%) of these patients with an additional diagnosis of hypertension. The final study population consisted of 37,425 (73.0%) of these patients who had recorded BP measurements available during the period of between six and 12 months following the time of laboratory evidence of CKD. This time period was used to allow for delays in any changes to therapy and the gradual achievement of the desired BP level. The BP used in the analyses was the last recorded in this period for each patient. If two BP measurements were registered on any single date, the lowest measurement was used. Target BP values were taken as ≤130/80 mmHg for patients with concomitant diabetes, CVD or albuminuria, and ≤140/90 mmHg for the remainder.11
To recap, the final set of 37,425 patients were (i) active (at least three GP visits within two years at any point within the whole data collection period of three years and five months); (ii) had laboratory evidence of CKD within the data collection period, with an additional diagnosis of hypertension; and (iii) had recorded BP measurements available during the period between six and 12 months following the time of laboratory evidence of CKD. CoC was then calculated for each included patient after the time of laboratory evidence of CKD, over the remainder of the data collection period, using the Herfindahl–Hirschman Index, which has been shown to be highly correlated with other common measures of CoC.23 Low CoC in general practice, measured with this index, has also been associated with a higher risk of mortality.24,25 If pi is the proportion of a patient’s visits where the patient sees doctor i, CoC = ∑𝑝𝑖2.
For example, if a patient makes 10 visits to GPs – seven visits (70%) to doctor A, two visits (20%) to doctor B, and 1 visit (10%) to doctor C – the patient’s CoC is 0.72 + 0.22 + 0.12 = 0.54 (medium). If another patient also makes 10 visits to GPs, but four of them to doctor A, three of them to doctor B, and three to doctor C, CoC is lower (0.42 + 0.32 + 0.32 = 0.34; low). CoC can take values ranging from close to 0 (a large number of visits, all to different doctors) to 1 (all visits to the same doctor). Patients were subsequently categorised into four groups on the basis of the CoC – those with maximum perfect continuity and the remainder split by approximate tertiles (cut points of 0.5 and 0.75).
Data analysis
Statistical calculations were performed using the language of R.26 Multivariable logistic regression analysis was used to identify factors associated with achievement of recommended target BP levels. Variables identified as being associated with achieving adequate BP control through univariate analysis, as well as age group, sex, baseline CKD stage, rurality, socioeconomic status and Aboriginal and/or Torres Strait Islander status, were all initially included in the regression model. A backwards selection procedure was implemented to determine the final regression model that included the review of nested models and analysis of likelihood ratio tests, and residual plots. Consequently, the number of GP encounters, GPs’ documentation of CKD, CoC and presence of CVD and diabetes were also included in the final regression model. As a result of the large sample size, patients and measurements, a two-sided P value of <0.001 was deemed to be statistically significant for the logistic regression model. The Tasmanian Health and Medical Human Research Ethics Committee approved the study (H0015651).
Results
Characteristics of the patients are shown in Table 1. There was a predominance of patients aged ≥70 years (81.7%). Figure 1 shows the distribution of CoC in the sample population. Overall, 17,469 (46.7%) of the patients had achieved a target BP; this proportion was 61.5% among the patients without concomitant diabetes, CVD or albuminuria, and only 38.2% in those with a lower target because of the presence of at least one of these factors.
| Table 1. Characteristics of patients with chronic kidney disease and hypertension, by sex |
| Variable |
n (%) |
Female
21,071 (56.3) |
Male
16,354 (43.7) |
P value |
Age group, years
<70
70–79
80–89
≥90 |
6,872 (18.6)
13,232 (35.4)
14,188 (37.9)
3,133 (8.4) |
3,358 (15.9)
7,057 (33.5)
8,526 (40.5)
2,130 (10.1) |
3,514 (21.5)
6,175 (37.8)
5,662 (34.6)
1,003 (6.1) |
<0.001 |
CKD stage
3a
3b
4
5 |
25,107 (67.1)
9,599 (25.7)
2,358 (6.3)
361 (1.0) |
14,130 (67.1)
5,498 (26.1)
1,283 (6.1)
160 (0.8) |
10,977 (67.1)
4,101 (25.1)
1,075 (6.6)
201 (1.2) |
<0.001 |
Diabetes
Yes |
13,044 (34.9) |
6,664 (31.6) |
6,380 (39.0) |
<0.001 |
CVD
Yes |
15,640 (41.8) |
7,901 (37.5) |
7,739 (47.3) |
<0.001 |
Atrial fibrillation
Yes |
6,014 (16.1) |
3,203 (15.2) |
2,811 (17.2) |
<0.001 |
Anxiety
Yes |
5,122 (13.7) |
3,655 (17.3) |
1,467 (9.0) |
<0.001 |
Rurality
Major cities
Inner regional
Outer regional
Remote |
21,926 (58.6)
10,080 (26.9)
4,781 (12.8)
474 (1.3) |
12,500 (59.6)
5,661 (27.0)
2,583 (12.3)
246 (1.2) |
9,426 (57.9)
4,419 (27.2)
2,198 (13.5)
228 (1.4) |
<0.001 |
SEIFA
Most disadvantaged
Middle
Most advantaged |
10,863 (29.0)
15,551 (41.6)
10,818 (28.9) |
6,099 (29.1)
8,795 (41.9)
6,081 (29.0) |
4,764 (29.3)
6,756 (41.6)
4,737 (29.1) |
0.760 |
Indigenous status*
Aboriginal/Torres Strait Islander
Non-Indigenous |
400 (1.4)
28,745 (98.6) |
229 (1.4)
16,154 (98.6) |
171 (1.3)
12,591 (98.7) |
0.711 |
GP-documented CKD
Yes |
9,480 (25.3) |
5,013 (23.8) |
4,467 (27.3) |
<0.001 |
|
GP continuity of care
Low
Middle
High
Maximum (1)
|
12,406 (33.2)
10,998 (29.4)
11,170 (29.9)
2,849 (7.6) |
7,074 (33.6)
6,315 (30.0)
6,204 (29.4)
1,476 (7.0) |
5,332 (32.6)
4,683 (28.6)
4,966 (30.4)
1,373 (8.4) |
<0.001 |
*Data missing for 22% of the sample
CKD, chronic kidney disease; CVD, cardiovascular disease; GP, general practitioner; SEIFA, Socio-Economic Indexes for Areas |
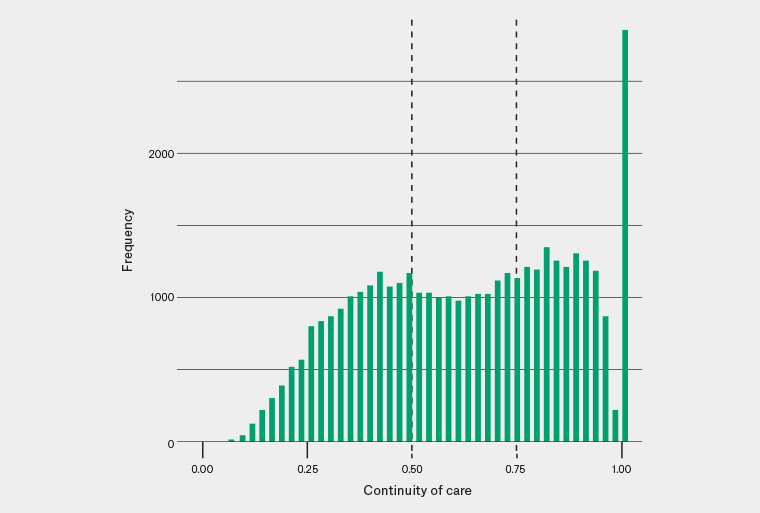
Figure 1. Distribution of continuity of care among the patients with chronic kidney disease and hypertension
Figure 2 shows the concentration of patients with specific BP levels by different cut-offs, in scatter plots. It was mostly the systolic BP that was higher than recommended among the patients without concomitant diabetes, CVD or albuminuria (high density of points within the lower right-hand quadrant of Figure 2), while both diastolic and systolic BP were often higher than the target level in individuals with one or more of these factors (high density of points within both the upper and lower right-hand quadrants).
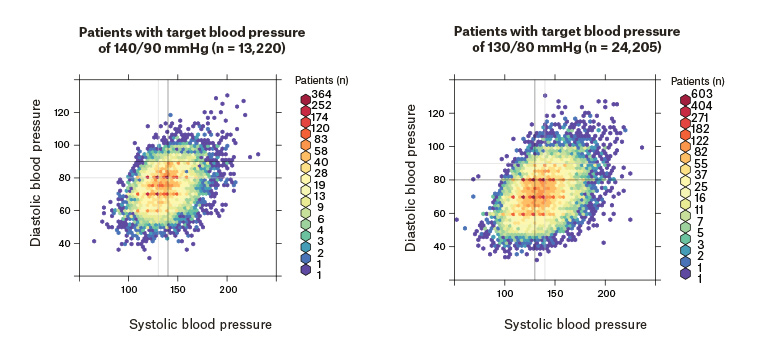
Figure 2. Distribution of the patients with chronic kidney disease and hypertension, by different blood pressure targets
Table 2 presents results from the final multivariable logistic regression model, showing factors independently associated with BP control. Higher CoC was positively associated with BP control; seeing a single GP increased the likelihood of having a BP below the target level by 22%, after adjusting for all other variables. Similarly, seeing a GP more frequently (a doubling in number of GP visits within the period of time after laboratory evidence of CKD and the remainder of the data collection period) increased the odds of having a BP below the target level by 18%. The mean (standard deviation) number of GP visits within the 12 months following laboratory evidence of CKD was 15.5 (10.9). CoC tended to be higher within major cities and in the most advantaged; however, CoC was a stronger independent predictor of BP control than either rurality or socioeconomic index.
Patients with coexisting diabetes or CVD, and therefore having lower BP targets, were far less likely to have their BP below the target level. The independent effects of age and sex were much smaller, with older age groups (80–89 years and ≥90 years) and females less likely to have achieved a target BP.
| Table 2. Multivariable logistic regression: Factors associated with achieving specific BP targets in patients with chronic kidney disease and hypertension |
| Variable |
Categories
(% who achieved target) |
Unadjusted OR
(95% CI) |
Adjusted OR
(95% CI) |
P value |
| Age group, years |
<70 (49.7)
70–79 (47.9)
80–89 (44.6)
≥90 (44.5) |
Ref
0.93 (0.88, 0.98)
0.81 (0.77, 0.86)
0.81 (0.74, 0.88) |
Ref
0.93 (0.88, 0.99)
0.81 (0.76, 0.86)
0.77 (0.72, 0.86) |
0.04
<0.0001
<0.0001 |
| Sex |
Female (46.1)
Male (47.4) |
Ref
1.05 (1.01, 1.10) |
Ref
1.13 (1.09, 1.18) |
<0.0001 |
Stage of CKD
|
3a (47.4)
3b (45.0)
4 (44.8)
5 (47.7) |
Ref
1.01 (0.82, 1.25)
0.90 (0.82, 0.98)
0.90 (0.86, 0.95) |
Ref
0.97 (0.92, 1.01)
1.00 (0.92, 1.10)
1.06 (0.85, 1.31) |
0.15
0.93
0.61 |
| Diabetes |
No diabetes (51.5)
Having diabetes (37.6) |
Ref
0.58 (0.56, 0.61) |
Ref
0.57 (0.54, 0.59) |
<0.0001 |
| CVD |
No CVD (51.0)
Having CVD (40.6) |
Ref
0.66 (0.63, 0.68) |
Ref
0.66 (0.63, 0.69) |
<0.0001 |
| Rurality |
Major cities (46.4)
Inner regional (45.6)
Outer regional (50.1)
Remote (44.7) |
Ref
0.97 (0.92, 1.01)
1.15 (1.09, 1.23)
0.93 (0.77, 1.12) |
Ref
0.93 (0.88, 0.98)
1.10 (1.03, 1.18)
0.90 (0.74, 1.08) |
0.007
0.006
0.25 |
| SEIFA |
Most disadvantaged (46.6)
Middle (46.9)
Most advantaged (46.5) |
Ref
1.00 (0.96, 1.06)
0.99 (0.94, 1.05) |
Ref
1.02 (0.97, 1.07)
0.97 (0.92, 1.03) |
0.55
0.37 |
| Indigenous status |
Aboriginal and/or
Torres Strait Islander (44.0)
Non-Indigenous (46.5) |
Ref
1.11 (0.91, 1.36) |
Ref
1.02 (0.83, 1.25) |
0.85 |
| GP encounters |
(Two-fold increase) |
0.99 (0.96, 1.02) |
1.18 (1.13, 1.22) |
<0.0001 |
| GP-documented CKD |
No (47.3)
Yes (44.8) |
Ref
0.91 (0.86, 0.95) |
Ref
0.94 (0.90, 0.99) |
0.018 |
| GP continuity of care |
Low (45.4)
Middle (47.1)
High (47.2)
Maximum = 1 (48.6) |
Ref
1.07 (1.02, 1.13)
1.08 (1.02, 1.13)
1.14 (1.05, 1.13) |
Ref
1.10 (1.04, 1.15)
1.12 (1.07, 1.19)
1.21 (1.11, 1.32) |
0.0008
<0.0001
<0.0001 |
| BP, blood pressure; CI, confidence interval; CKD, chronic kidney disease, CVD, cardiovascular disease; eGFR; estimated glomerular filtration rate; GP, general practitioner; OR, odds ratio; Ref, reference; SEIFA, Socio-Economic Indexes for Areas |
Discussion
Less than half of the patients with CKD and hypertension had BP values meeting the guideline-recommended target values. This was predominantly due to individuals not achieving the stricter BP goal (≤130/80 mmHg) recommended if there was concomitant diabetes, CVD and/or albuminuria. These results probably reflect the difficulties in achieving a lower target BP in a largely older group of patients, also at risk of hypotension and falls. Although evidence suggests patients aged ≥75 years gain an overall benefit from lowering BP,27 many GPs may be reluctant to aim for BPs ≤140/90 mmHg or ≤130/80 mmHg, fearing the patient’s falls risk outweighs other health gains.27 We did not, however, attempt to examine hypotension in the MedicineInsight data. GPs may also be reluctant to aggressively lower BP as there is uncertainty about the effect of intensive BP-lowering on renal function in these older patients.28 Further research is required to directly examine this particular area.
There is scarcity of data on BP control in patients with CKD in Australia. One study found that among patients with CKD who were prescribed BP-lowering agents, 61% did not meet the guideline-recommended BP target.29 Apart from avoiding the dangers of inducing hypotension in the elderly, possible reasons for the observed practice–guideline gap include resistant hypertension (especially with concomitant CKD), poor adherence with therapy and inadequate use of antihypertensive drugs.8,30,31
Importantly, patients who had more visits to a GP and who had higher relational CoC were more likely to achieve target BP levels. A dose–response relationship was found, with patients with the maximum CoC (care from the same GP for the analysis period) being 22% more likely to have achieved the recommended target BP levels. Thus, continuity of general practice care – the ongoing therapeutic relation between the patient and a single GP that bridges episodes of care32,33 – has seemingly exerted an impact in this study on achieving target BP levels. To the best of our knowledge, our study is the first in Australia to look at the association of CoC with achievement of guideline-recommended BP control among patients with CKD.
This study comprised a large cohort of patients from general practices across the country. The patient characteristics of the dataset were similar to the Australian population. Despite the strengths, this study has some limitations. The cross-sectional nature of the study could only retrospectively investigate the association of the CoC with BP control, and not determine causation. Each participating general practice has chosen to be part of the MedicineInsight program. Patient information was collected by GPs for clinical decision-making, not research purposes. All health and demographic information may not have been entered in the medical record system. For example, Aboriginal and Torres Strait Islander status was missing for approximately 22% of the patients. It is possible that BP values were recorded within patient notes and not included in the research data.
The recording of clinical encounters or visits, used to calculate CoC, may have limitations. In general practice information systems, an encounter is recorded any time a patient’s electronic medical record is accessed, regardless of whether this was for clinical purposes. MedicineInsight has a set of criteria to probabilistically define a clinical encounter and exclude administrative encounters. These include being associated with a GP or practice nurse, not including terms in ‘reason for encounter’ that indicate an administrative record only, containing at least one entry in the ‘diagnosis’, ‘reason for encounter’ or ‘reason for prescription’ fields, and having a duration longer than three minutes. However, it is possible that some administrative encounters were still included in our analysis. Finally, tracking patients’ attendance at multiple practices was not possible.
In conclusion, attainment of the guideline-recommended BP levels was reasonably good in patients with CKD and hypertension, without other risk factors. However, it was much poorer in the presence of concomitant diabetes or CVD, seemingly due to a lower BP target. The study also highlighted the importance of more GP visits, and especially the CoC, in the management of hypertension in patients with CKD. Based on the results, it would seem beneficial for GPs to increase the CoC given to patients with CKD, with special attention given to females and older individuals.