In Australia in 2015, rheumatoid arthritis (RA) ranked 14th of the 20 leading causes of total disease burden.1 The Australian population prevalence of RA has been reported at 0.5–0.6%,2,3 and significantly higher for females than for males.4,5 General practitioners (GPs) play an important part in the early diagnosis and management of RA through referral to specialists, coordination and continuity of care, and ongoing co-management with other health professionals.6–8 Recommended medication regimens are documented in the Royal Australian College of General Practitioners (RACGP) RA guidelines6 and elsewhere.2,9
The RACGP guidelines also recommend early referral to a specialist to improve patient outcomes;6,10 however, access to specialists often differs across geographic areas.11 The effect of rurality on patient and GP characteristics and RA management practices has not been examined. The aims of this study were to examine: RA management rates over the decade April 2006 to March 2016, treatments provided by GPs on RA management occasions, characteristics of patients managed for RA and the GPs who managed it, and differences across regional areas and areas of socioeconomic advantage/disadvantage.
Methods
Data collected from April 2006 to March 2016 inclusive, through the Bettering the Evaluation and Care of Health (BEACH) program, were analysed. BEACH was a continuous, nationally representative cross-sectional survey of Australian GP activity conducted from April 1998 to March 2016. BEACH methods are described in detail elsewhere.12 In brief, approximately 1000 GPs from a rolling random sample recorded, on structured paper forms, details of 100 GP–patient encounters with consenting, unidentified patients, providing approximately 100,000 GP–patient encounter records per year.
Management actions (medications, clinical and procedural treatments, referrals, investigations) were directly linked by the GP to the problem managed. The problems, referrals and non-pharmacological treatments were coded using the International Classification of Primary Care, Version 2 PLUS (ICPC-2-PLUS).13 RA was defined as ICPC-2-PLUS code L88004 – ‘Rheumatoid arthritis’.14 GPs were instructed to record new (first presentation to any provider) and continuing RA problems, and new referrals only (ie not continuation referrals). ‘RA management occasions’ or ‘RA contacts’ are GP–patient encounters during which RA was managed. Medications for RA were classified using the Anatomical Therapeutic Chemical (ATC) classification.15 Medications described as disease-modifying antirheumatic drugs (DMARDs) by Arthritis Australia were analysed by individual ATC codes (listed in Appendix 1), as the ATC does not have a labelled ‘DMARD’ category.
On the basis of postcode, ‘rurality’ was defined according to the Australian Statistical Geographical Standard (ASGS)16 and grouped as major cities, inner regional and outer regional/remote/very remote. Postcode was classified to the Socio-Economic Indexes for Areas (SEIFA) Index of Relative Socio-economic Advantage and Disadvantage (IRSAD): 1–5 = low advantage/high disadvantage; 6–10 = high advantage/low disadvantage.17 Other patient characteristics included whether each: had a Commonwealth healthcare card (HCC), was new to the practice, self-identified as an Aboriginal and/or Torres Strait Islander (Indigenous status), or spoke a language other than English primarily at home (non–English speaking background [NESB] status). GPs completed a profile including their age, sex and country of primary medical degree (classified as ‘Australian graduate’ or not).
Statistical analyses
Proportions reported were calculated using Statistical Analysis System Version 9.4, which accounted for the cluster design of the study. Proportions are expressed as the proportion of all encounters where RA was managed and as the proportion of RA management occasions where at least one management action was recorded. Statistical significance of difference was determined by non-overlapping 95% confidence intervals (CIs), a more conservative test than α of 0.05.18
Ethics approval
The BEACH program was approved by the Human Research Ethics Committee of the University of Sydney (2006–2016) REF: 2012/130 (valid to 31/12/2022) and the Ethics Committee of the Australian Institute of Health and Welfare (2006–2011).
Results
There was no significant change in the annual proportion of encounters during which RA was managed over the study period (Figure 1). The 10-year average was 0.38% (95% CI: 0.37, 0.40; Table 1); that is, for every 10,000 encounters, 38 involved RA management.
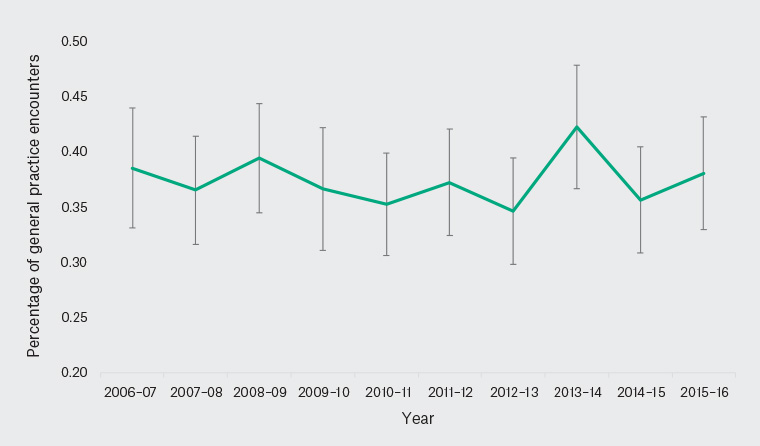
Figure 1. Proportion of general practitioner–patient encounters where rheumatoid arthritis was managed, by year (2006–16)
Error bars indicate 95% confidence intervals
| Table 1. Patient characteristic-specific rheumatoid arthritis management at general practitioner–patient encounters, by rurality (2006–16) |
|
Patient
characteristics
|
Major city
(n = 687,500)
% (95% CI) |
Inner regional
(n = 187,800)
% (95% CI) |
Outer regional/remote (n = 95,400)
% (95% CI) |
Total encounters
(n = 972,100)
% (95% CI) |
| Total |
0.33 (0.31, 0.35) |
0.50 (0.46, 0.53) |
0.53 (0.47, 0.58) |
0.38 (0.37, 0.40) |
| Sex |
| Male |
0.19 (0.17, 0.21) |
0.33 (0.29, 0.38) |
0.38 (0.31, 0.44) |
0.24 (0.22, 0.25) |
| Female |
0.43 (0.40, 0.45) |
0.61 (0.56, 0.66) |
0.64 (0.55, 0.72) |
0.48 (0.46, 0.50) |
| Age group |
| <25 years |
0.03 (0.02, 0.04) |
0.03 (0.01, 0.05) |
0.05 (0.01, 0.09) |
0.03 (0.02, 0.04) |
| 25–44 years |
0.13 (0.11, 0.15) |
0.19 (0.14, 0.24) |
0.24 (0.17, 0.31) |
0.15 (0.14, 0.17) |
| 45–64 years |
0.47 (0.44, 0.51) |
0.69 (0.62, 0.76) |
0.81 (0.69, 0.92) |
0.55 (0.52, 0.58) |
| 65–79 years |
0.66 (0.61, 0.71) |
0.86 (0.76, 0.95) |
0.78 (0.64, 0.93) |
0.72 (0.68, 0.76) |
| ≥80 years |
0.44 (0.38, 0.49) |
0.50 (0.40, 0.61) |
0.57 (0.41, 0.73) |
0.47 (0.42, 0.51) |
| Healthcare card |
| Yes |
0.51 (0.48, 0.54) |
0.68 (0.62, 0.74) |
0.71 (0.61, 0.81) |
0.57 (0.55, 0.60) |
| No |
0.21 (0.20, 0.23) |
0.32 (0.27, 0.36) |
0.37 (0.31, 0.43) |
0.25 (0.23, 0.26) |
| Language background |
| Non–English speaking* |
0.26 (0.22, 0.30) |
0.20 (0.03, 0.38) |
0.52 (0.23, 0.80) |
0.27 (0.23, 0.31) |
| English-speaking |
0.35 (0.33, 0.37) |
0.51 (0.47, 0.55) |
0.54 (0.48, 0.60) |
0.41 (0.39, 0.42) |
| Advantage level† |
| High |
0.32 (0.30, 0.33) |
0.47 (0.42, 0.53) |
0.44 (0.33, 0.54) |
0.34 (0.32, 0.35) |
| Low |
0.37 (0.34, 0.40) |
0.51 (0.46, 0.56) |
0.55 (0.48, 0.62) |
0.45 (0.42, 0.47) |
| Indigenous status |
| Aboriginal or Torres Strait Islander |
0.36 (0.18, 0.53) |
0.14 (0.02, 0.25) |
0.35 (0.21, 0.48) |
0.30 (0.21, 0.38) |
| Non-Indigenous |
0.34 (0.33, 0.36) |
0.52 (0.48, 0.56) |
0.56 (0.49, 0.62) |
0.40 (0.38, 0.41) |
| New to practice |
| Yes |
0.11 (0.08, 0.14) |
0.14 (0.08, 0.21) |
0.16 (0.07, 0.25) |
0.12 (0.10, 0.15) |
| No |
0.35 (0.33, 0.37) |
0.52 (0.48, 0.56) |
0.57 (0.50, 0.63) |
0.40 (0.39, 0.42) |
*Primary language spoken at home is not English
†Advantage level defined by the Socio-Economic Indexes for Areas (SEIFA) Index of Relative Socio-economic Advantage and Disadvantage (IRSAD)17
CI, confidence interval |
Patient characteristics
RA management was significantly higher for female patients (0.48%) than for males (0.24%; Table 1). The proportion increased with each age group, peaking among patients aged 65–79 years, then significantly decreasing at encounters with those aged ≥80 years.
When compared with their counterparts, RA management was significantly higher for patients: with an HCC (0.57%, compared with 0.25%), from an English-speaking background (0.41%, compared with 0.27%), in areas of lower socioeconomic advantage (0.45%, compared with 0.34%), and who had attended the practice previously (0.40%, compared with 0.12%). RA management among Aboriginal and Torres Strait Islander patients (0.30%) was only marginally lower than among non-Indigenous patients (0.40%; 95% CIs met but did not overlap). RA management rates across rurality groups for these patient characteristics are also shown in Table 1.
General practitioner characteristics
There was no significant difference in total RA management between male (0.39%) and female (0.38%) GPs (Table 2). RA management was significantly higher for GPs aged ≥55 years (0.44%) than for GPs aged 45–54 years (0.38%) and <45 years (0.29%).
Male and female GPs did not differ in RA management within each of the geographic categories and reflected the trend of increasing with GP age. In major cities, RA management was significantly higher for Australian graduate GPs than for overseas-trained GPs (Table 2).
| Table 2. General practitioner (GP) characteristic-specific rheumatoid arthritis management at GP–patient encounters, by rurality (2006–16) |
| General practitioner characteristics |
Major city
(n = 687,500)
% (95% CI) |
Inner regional
(n = 187,800)
% (95% CI) |
Outer regional/remote (n = 95,400)
% (95% CI) |
Total encounters
(n = 972,100)
% (95% CI) |
| Total |
0.33 (0.31, 0.35) |
0.50 (0.46, 0.53) |
0.53 (0.47, 0.58) |
0.38 (0.37, 0.40) |
| Sex |
| Male |
0.33 (0.31, 0.35) |
0.48 (0.44, 0.53) |
0.56 (0.49, 0.63) |
0.39 (0.37, 0.40) |
| Female |
0.33 (0.31, 0.36) |
0.52 (0.45, 0.58) |
0.46 (0.36, 0.56) |
0.38 (0.35, 0.40) |
| Age group |
| <45 years |
0.23 (0.21, 0.26) |
0.38 (0.32, 0.44) |
0.41 (0.31, 0.51) |
0.29 (0.26, 0.31) |
| 45–54 years |
0.31 (0.29, 0.34) |
0.54 (0.47, 0.62) |
0.53 (0.43, 0.63) |
0.38 (0.36, 0.41) |
| ≥55 years |
0.40 (0.37, 0.42) |
0.55 (0.48, 0.61) |
0.63 (0.52, 0.74) |
0.44 (0.42, 0.47) |
| Australian graduate* |
| No |
0.30 (0.27, 0.32) |
0.48 (0.40, 0.56) |
0.55 (0.45, 0.65) |
0.36 (0.33, 0.38) |
| Yes |
0.35 (0.33, 0.36) |
0.50 (0.46, 0.55) |
0.52 (0.44, 0.59) |
0.39 (0.38, 0.41) |
*Completed their primary medical degree in Australia
CI, confidence interval |
Management actions for rheumatoid arthritis
Table 3 shows the RA management actions reported as proportions of RA management occasions. Nationally, at least one medication was prescribed/advised/supplied by the GP (hereto referred to as ‘prescribed’) at 66.3% of RA encounters. The most commonly prescribed were DMARDs (34.8%), corticosteroids (13.2%), opioids (12.5%) and nonsteroidal anti-inflammatory drugs (NSAIDs; 12.1%).
| Table 3. Proportion of rheumatoid arthritis contacts that received specific management actions (at least one), by rurality and for ‘new’ rheumatoid arthritis problems (2006–16) |
| Management |
Major city
(n = 2286)
% (95% CI) |
Inner regional
(n = 913)
% (95% CI) |
Outer regional/remote (n = 502)
% (95% CI) |
Total RA contacts
(n = 3708)
% (95% CI) |
New RA contacts
(n = 193)
% (95% CI) |
| Medications |
66.9 (64.9, 69.0) |
64.4 (61.0, 67.9) |
66.5 (62.3, 70.7) |
66.3 (64.7, 67.9) |
54.9 (47.7, 62.1) |
| DMARDs |
35.3 (33.2, 37.5) |
34.2 (30.5, 37.8) |
33.5 (29.0, 38.0) |
34.8 (33.1, 36.5) |
14.0 (9.0, 19.0) |
| Methotrexate |
22.0 (20.1, 23.9) |
23.2 (19.9, 26.5) |
21.7 (17.5, 25.9) |
22.3 (20.8, 23.8) |
8.3 (4.3, 12.2) |
| Hydroxychloroquine |
7.1 (6.0, 8.2) |
6.5 (4.8, 8.1) |
5.4 (3.3, 7.5) |
6.7 (5.9, 7.5) |
3.6 (1.0, 6.3) |
| Leflunomide |
3.5 (2.7, 4.3) |
3.9 (2.6, 5.3) |
5.8 (3.6, 8.0) |
3.9 (3.3, 4.6) |
1.0 (0.0, 2.5) |
| Corticosteroids |
11.9 (10.5, 13.2) |
14.7 (12.1, 17.2) |
16.5 (13.0, 20.1) |
13.2 (12.0, 14.3) |
14.0 (8.9, 19.1) |
| Prednisolone/Prednisone |
11.5 (10.2, 12.9) |
14.0 (11.6, 16.5) |
15.9 (12.4, 19.5) |
12.8 (11.6, 13.9) |
13.0 (8.0, 17.9) |
| Opioids |
11.8 (10.4, 13.2) |
12.2 (10.0, 14.4) |
16.1 (12.9, 19.3) |
12.5 (11.4, 13.6) |
6.2 (2.8, 9.7) |
| Oxycodone |
3.1 (2.4, 3.9) |
3.6 (2.4, 4.8) |
5.0 (3.0, 6.9) |
3.5 (2.9, 4.1) |
0.5 (0.0, 1.5) |
| Tramadol |
2.3 (1.6, 2.9) |
2.1 (1.1, 3.1) |
3.0 (1.5, 4.5) |
2.3 (1.8, 2.8) |
1.0 (0.0, 2.5) |
| Buprenorphine |
1.5 (1.0, 2.0) |
2.8 (1.7, 4.0) |
2.0 (0.8, 3.2) |
1.9 (1.5, 2.4) |
0.5 (0.0, 1.5) |
| NSAIDs |
12.9 (11.4, 14.3) |
10.7 (8.6, 12.8) |
11.2 (7.8, 14.5) |
12.1 (11.0, 13.3) |
24.9 (18.3, 31.4) |
| Meloxicam |
4.7 (3.8, 5.6) |
4.3 (2.8, 5.8) |
2.6 (1.2, 4.0) |
4.4 (3.7, 5.1) |
7.3 (3.1, 11.4) |
| Celecoxib |
3.9 (3.1, 4.7) |
2.6 (1.6, 3.7) |
4.0 (1.8, 6.2) |
3.6 (2.9, 4.2) |
8.8 (4.3, 13.3) |
| Naproxen |
1.4 (0.9, 1.9) |
1.2 (0.5, 1.9) |
0.8 (0.01, 1.6) |
1.3 (0.9, 1.6) |
2.6 (0.3, 4.9) |
| Folic acid |
4.2 (3.3, 5.0) |
4.4 (3.0, 5.7) |
5.2 (3.0, 7.3) |
4.4 (3.7, 5.1) |
2.6 (0.3, 4.9) |
| Paracetamol |
4.8 (3.9, 5.7) |
5.5 (3.9, 7.0) |
4.0 (2.2, 5.8) |
4.9 (4.2, 5.6) |
7.8 (4.0, 11.6) |
| Paracetamol/Codeine |
3.1 (2.4, 3.9) |
2.4 (1.4, 3.4) |
3.2 (1.6, 4.8) |
3.0 (2.4, 3.6) |
2.6 (0.3, 4.9) |
| Pathology |
19.5 (17.8, 21.1) |
22.0 (19.3, 24.7) |
27.9 (23.8, 31.9) |
21.2 (19.8, 22.5) |
33.7 (26.8, 40.5) |
| FBC |
15.6 (14.0, 17.1) |
18.5 (16.0, 21.0) |
22.9 (19.1, 26.7) |
17.3 (16.0, 18.5) |
21.2 (15.3, 27.2) |
| CRP |
9.2 (8.0, 10.5) |
11.7 (9.6, 13.9) |
14.3 (11.0, 17.7) |
10.5 (9.5, 11.5) |
18.1 (12.5, 23.8) |
| ESR |
9.0 (7.8, 10.2) |
11.3 (9.2, 13.4) |
12.5 (9.3, 15.8) |
10.0 (9.0, 11.0) |
18.1 (12.5, 23.8) |
| LFT |
8.1 (6.9, 7.3) |
11.8 (9.6, 14.0) |
11.6 (9.1, 14.8) |
9.5 (8.5, 10.5) |
5.7 (2.4, 9.0) |
| EUC |
3.3 (2.6, 4.1) |
6.0 (4.4, 7.6) |
5.2 (3.1, 7.3) |
4.2 (3.6, 4.9) |
2.6 (0.3, 4.9) |
| RhF |
2.8 (2.1, 3.5) |
3.3 (2.1, 4.4) |
3.4 (1.8, 5.3) |
3.0 (2.5, 4.0) |
20.2 (14.4, 26.1) |
| ANA |
1.3 (0.8, 1.8) |
0.7 (0.1, 1.2) |
1.2 (0.2, 2.2) |
1.1 (0.8, 1.5) |
11.4 (6.8, 15.9) |
| Lipids |
0.8 (0.4, 1.1) |
0.8 (0.2, 1.3) |
1.2 (0.3, 2.1) |
0.8 (0.5, 1.1) |
1.6 (0.0, 3.3) |
| Multibiochemical |
0.7 (0.4, 1.1) |
1.0 (0.3, 1.7) |
0.6 (–0.1, 1.3) |
0.8 (0.5, 1.1) |
1.0 (0.0, 2.5) |
| TFT |
0.5 (0.2, 0.8) |
0.5 (0.7, 1.0) |
0.8 (0.1, 1.6) |
0.5 (0.3, 0.8) |
0.5 (0.0, 1.5) |
| CCP antibody |
0.5 (0.2, 0.8) |
0.4 (0.01, 0.9) |
0.6 (–0.1, 1.3) |
0.5 (0.3, 0.7) |
2.6 (0.3, 4.9) |
| Imaging |
2.7 (2.0, 3.3) |
3.1 (1.9, 4.2) |
4.6 (2.7, 6.5) |
3.0 (2.5, 3.6) |
14.5 (9.5, 19.5) |
| Referral |
14.0 (12.5, 15.4) |
13.6 (11.3, 15.9) |
12.2 (9.2, 15.1) |
13.6 (12.5, 14.7) |
29.0 (22.4, 35.6) |
| Rheumatologist |
9.6 (8.3, 10.8) |
9.1 (7.2, 11.0) |
8.6 (6.0, 11.1) |
9.3 (8.3, 10.3) |
24.9 (18.6, 31.2) |
| Podiatrist |
1.2 (0.7, 1.6) |
0.9 (0.3, 1.5) |
1.0 (0.1, 1.9) |
1.1 (0.7, 1.4) |
0.5 (0.0, 1.5) |
| Ophthalmologist |
0.5 (0.2, 0.8) |
0.5 (0.1, 1.0) |
0.6 (–0.1, 1.3) |
0.5 (0.3, 0.7) |
0.5 (0.0, 1.5) |
| Counselling and advice |
7.7 (6.5, 8.8) |
9.2 (7.2, 11.2) |
8.8 (5.3, 12.2) |
8.7 (7.2, 9.2) |
13.5 (8.7, 18.2) |
| ANA, anti-nuclear antibodies; CCP, cyclic citrullinated peptide; CI, confidence interval; CRP, C-reactive protein; DMARDs, disease-modifying antirheumatic drugs; ESR, erythrocyte sedimentation rate; EUC, electrolytes, urea and creatinine; FBC, full blood count; LFT, liver function tests; NSAIDs, nonsteroidal anti-inflammatory drugs; RA, rheumatoid arthritis; RhF, rheumatoid factor; TFT, thyroid function tests |
Pathology tests were ordered at 21.2% of RA encounters, most commonly full blood count (FBC), C-reactive protein (CRP) and erythrocyte sedimentation rate (ESR). Imaging was ordered at 3.0% of total RA encounters.
Referrals were recorded at 13.6% of RA encounters, the majority being to rheumatologists (9.3%). GPs provided counselling/advice to patients about RA management at 8.7% of RA encounters, about medication/pain management, lifestyle factors (eg weight loss, diet, exercise, alcohol, smoking) and psychological support.
Management actions for rheumatoid arthritis by rurality
Prescribing did not differ significantly by rurality. Pathology tests were ordered significantly more often in outer regional/remote/very remote areas (27.9%) than in major cities (19.5%). This difference was mainly due to the significantly higher ordering of FBC in outer regional/remote/very remote areas (22.9%) when compared with major cities (15.6%) and nationally (17.3%.); CRP in outer regional/remote/very remote areas (14.3%) when compared with major cities (9.2%); and electrolytes, urea and creatinine in inner regional areas (6.0%) when compared with major cities (3.3%).
There were no significant differences in imaging ordering, referrals or counselling/advice provided for RA management by rurality (Table 3).
Management actions for new rheumatoid arthritis problems
Table 3 also shows the management actions where RA was recorded as a new problem for the patient. When compared with total RA contacts, there were significant differences in the proportions of prescribed medications (ie fewer DMARDs and opioids, more NSAIDs), pathology tests (more CRP, ESR, rheumatoid factor [RhF], anti-nuclear antibodies), imaging and referrals to rheumatologists recorded for new RA contacts.
Discussion
This study investigated GP–patient encounters for RA management across a decade, specifically patient and GP characteristics, and treatments provided for RA management nationally, by rurality and for new RA presentations.
The results show that the proportion of RA encounters remained relatively static across the decade. The higher proportion for female patients reflects the known higher prevalence of RA in females4,5 and its generally later onset among males.2 The increasing management with patient age may reflect the progressive nature of RA as a systemic disease potentially affecting multiple other organs, resulting in cardiovascular and respiratory comorbidities.19 The lower management in patients aged ≥80 years may reflect reduced life expectancy related to RA, associated with comorbidities.20,21
The higher rates of RA management in patients with HCCs and those with lower socioeconomic advantage levels (nationally and in major cities) are likely influenced by multiple factors, both causal and consequential. People living in the most disadvantaged areas are more likely to be current smokers and have obesity (factors that exacerbate symptoms of RA),22 and those who have developed debilitating chronic conditions may have a reduced capacity for employment,22 thus influencing their dependence on social security and their location of dwelling. Cost is also a major barrier to specialist care,23 which may influence the number of times patients visit a GP. That RA management was proportionally higher among continuing patients than among new patients reflects the preference of Australian patients to seek GP care at a regular practice, particularly for chronic conditions.24
RA management increased significantly with increasing GP age, perhaps reflecting previous findings that GPs attract patients closer to their own age, and that older GPs manage significantly more chronic problems than their younger counterparts.25
The lower national rate of RA management for NESB patients was only observed in major cities, not in rural areas. GP encounters with NESB patients are more likely to occur in metropolitan practices, and with GPs who mainly consult in a language other than English,26 but this does not explain why management of RA occurs less frequently for NESB patients and for overseas-trained GPs than their counterparts.
The management actions recorded appear to correlate with current management recommendations in the RACGP guidelines6,10 – although these are now 10 years old and may warrant revision. The pharmacological therapies of simple analgesics, NSAIDs, DMARDs and corticosteroids are those recommended in both national6 and international guidelines,27,28 as are the diagnostic investigations, referrals and counselling/advice. Given the risks associated with NSAID use, it would be useful to determine the duration of use for the 12% of RA contacts for whom NSAIDs were prescribed. Similarly, it would be useful to understand the proportions of patients continuing DMARDs or who fail to respond to initial methotrexate or other traditional DMARDs (resulting in the addition of biological agents) – and if this is also static, or an increasing trend – but cross-sectional data limit these investigations. Opioids (12.5% of RA contacts) should also be used prudently, given growing evidence of opioid-related harm.29 Generally, there were very few differences across rurality groups in the proportions of RA problem contacts receiving the management actions recorded, which suggests equity in the management provided by GPs across Australia.
The RACGP guidelines recommend GPs undertake a diagnostic process – history, clinical examination and diagnostic investigations (ESR and/or CRP, RhF and anti–cyclic citrullinated peptide [CCP] antibody) – and initial management plan (simple analgesics; NSAIDs, having evaluated cardiovascular, gastrointestinal and renal status). If these fail, GPs are recommended to prescribe low-dose corticosteroids (after consulting a rheumatologist), and DMARDs as early as possible for patients with poor prognosis; rheumatologist referral should occur immediately if RhF and/or anti-CCP antibody is positive, or within six weeks after persistent swelling in more than one joint, even if RhF is negative, or if NSAIDs/steroids are required beyond six weeks after initial treatment.6 Proportionally, for new RA contacts, pathology test ordering for CRP, ESR and RhF was significantly higher; NSAID prescribing significantly higher; DMARD and opioid prescribing significantly lower; and referrals to rheumatologists significantly higher, when compared with total RA contacts. These results suggest that GPs are likely adhering to guidelines where presentation warrants immediate prescribing and referral. The cross-sectional data limit the capacity to assess the proportion of patients who have appropriate multidisciplinary team care from the point of diagnosis so cannot show whether other management actions occurred within the recommended six-week window, or at all. For new and total RA contacts, there are also no criteria by which to assess whether these actions are occurring at appropriate levels (‘too much’, compared with ‘not enough’).
GPs have acknowledged low confidence in detecting RA,30 which may influence their decision to refer patients to specialists. In this study, over 68% of total referrals for RA management were to rheumatologists, reflecting clinical guideline recommendations.10 Referrals did not differ proportionally across rurality groups, suggesting that this intention was equal; however, the outcome of these referrals is unknown, as are the inequities that may have affected patient capacity to attend specialist consultations. Cost has been reported as the primary barrier for not seeing a specialist among patients aged ≥45 years in rural/remote areas23 and may also be a barrier in other geographical areas. It would be useful to know the proportions of patients who are unable to access specialist care when referred.
Counselling/advice/psychosocial support was provided at one in 11 recorded RA encounters, indicating that GPs are aware of this need, but whether this level of provision is adequate is unknown and may be influenced by time available at the encounter.
The details reported here are those recorded by the GP at the BEACH encounter. Referrals are only those referred at the recorded visit. Patients may have been referred at previous encounters, and it was not possible to establish duration of symptoms prior to referral or assess the management pathway leading to, and since, confirmation of diagnosis. This limitation also applies to management actions provided at previous GP encounters and management initiated by specialists and allied health professionals with whom the patient’s care is shared.
The strengths of the present study include a nationally representative dataset linking all management activities directly to the problem (RA) using recognised coding/classifications, resulting in valid, reliable data.12 The limitations are those of all cross-sectional data, in that actions occurring at encounters other than those recorded are unknown.
Conclusion
These results suggest that GP management actions align with current national guidelines and, in the main, do not differ by rurality. Further research focusing on complexity of cases, where failure of traditional DMARDs necessitates the introduction of biologics, with the additional complications of multimorbidity and resulting polypharmacy, would give greater insight to the needs of patients and how they may best be accommodated by the shared care of GPs and other health specialists.