International evidence suggests that systems with a focus on primary healthcare (PHC) have better health outcomes1,2 and lower health costs.3 PHC is typically the first point of contact with the health system and includes a broad range of treatment services along with health promotion, prevention and screening services that generally do not require a referral.4
Australia is thought to have a strong PHC sector,5 with most Australians receiving PHC services through their general practitioners (GPs). Other PHC providers include allied health professionals, midwives, nurse practitioners, pharmacists, dentists and Aboriginal health workers.6 Almost 88% of Australians had a Medicare Benefits Schedule (MBS)-subsidised GP visit in 2018/19, with an average of 7.2 services per patient.7 Over 85% of these services are delivered without cost to patients.8 Australian GPs receive most of their payments through MBS-subsidised fee-for-service consultations, with alternative payments for war veterans provided through the Department of Veterans Affairs (DVA) and the Practice Incentives Program (PIP), the latter of which provides additional payments to accredited general practices (as opposed to GPs) to support improvements in quality of care.
Understanding health resource allocation is an increasingly important component of health system reform. Initiatives such as Australia’s Medicare Benefits Schedule Review Taskforce9 and the Quadruple Aim10 internationally are highlighting a need to understand costs and cost-effectiveness of healthcare services, as well as their quality. Australia is currently developing a long-term national health plan,11 with stronger primary care identified as one of its priorities, and a Primary Health Reform Steering Group has drafted recommendations, including that a minimum but unquantified percentage of health system expenditure be dedicated to primary healthcare.12 Strengthening and better supporting general practices is also central to the ‘Vision for general practice and a sustainable health system’ (‘Vision’) released by The Royal Australian College of General Practitioners (RACGP) in 2019.13 The Vision calls for additional flexible general practice funding to support provision of better-coordinated, team-based PHC.13
Multiple institutions collect data and report on health expenditure related to the services and activities of PHC. These include the Australian Institute of Health and Welfare (AIHW), Productivity Commission and Services Australia in Australia, and the Organisation for Economic Cooperation and Development (OECD) internationally. While the data sources used to estimate PHC expenditure in Australia are common across these institutions, the definitions of PHC activities and detail provided differ substantially.
Quantifying health expenditure is a component of health system performance monitoring.14 This research aims to quantify how much of Australia’s health expenditure is allocated to PHC, and more specifically to general practice, as the frontline provider of the majority of PHC for many Australians.
By clearly documenting Australia’s health resource allocation, we seek to increase our capacity to monitor spending and understand the changing distribution of health resources.
Methods
Data
This article analyses and then compares the classification of general practice and PHC spending in three Australian data reports. First, annual health expenditure statistics reported by the AIHW15 and further detailed in Australia’s health (a biannual report on Australian health spending)4 are analysed. Second, AIHW’s additional report focusing exclusively on Medicare spending for GP services16 is reviewed. Third, the Productivity Commission’s Report on Government Services (RoGS)17 is analysed.
Each data source provides a different classification of services and spending that includes general practice services:
- AIHW health expenditure reports4,15 include general practice–related spending within ‘unreferred medical services’
- The RoGS17 discusses ‘spending on general practitioners’
- AIHW’s Medicare report16 discusses ‘Medicare-subsidised GP services’.
Comparing the classifications permits more detailed and precise estimates of spending than is provided by any single report.
Finally, Australian general practice and PHC expenditure is estimated using data from 2017/18 – the most recent year that all relevant data are available – and results reported in 2017/18 Australian dollars. This data exercise also uses additional information on PIP expenditure contained in the Department of Human Services (DHS) 2017/18 Annual Report.18
Results
Health expenditure reports
AIHW estimates that in 2017/18 $185.4 billion was spent on health goods and services, of which $63.4 billion (34% of total health expenditure) was spent on PHC.15 This classification includes healthcare unrelated to a hospital visit (eg health promotion, prevention and early intervention), ranks second in term of expenditure after hospital expenditure (40%) and includes spending on general practice care, allied health services, dental care, pharmacy and community health services.
The AIHW PHC classification can be refined further as shown in the lower half of Table 1. Of the $63.4 billion spent on PHC, approximately $12.7 billion is spent on unreferred medical services (which includes spending on general practice services). This represents approximately 6.8% of total health expenditure and 20% of expenditure on primary and community health.
| Table 1. Healthcare expenditure in Australia, including contribution to and breakdown of primary healthcare spending in Australia (figures in $million)15 |
| Area of expenditure |
Federal Government |
State government |
Health insurance providers |
Patient |
Other |
Total health exp |
% of total health exp |
% of PHC exp |
| Hospitals |
26,486 |
30,847 |
9,416 |
3,884 |
3,409 |
74,041 |
40.0% |
.. |
| Public hospitals |
22,725 |
29,860 |
1,248 |
1,692 |
2,168 |
57,694 |
31.0% |
.. |
| Private hospitals |
3,761 |
986 |
8,168 |
2,192 |
1,241 |
16,348 |
9.0% |
.. |
| Referred medical services |
14,444 |
.. |
1,729 |
3,218 |
.. |
19,391 |
10.0% |
.. |
| Other services |
3,564 |
4,009 |
2,527 |
3,406 |
217 |
13,723 |
7.0% |
.. |
| Research |
4,393 |
827 |
.. |
3 |
401 |
5,624 |
3.0% |
.. |
| Capital expenditure |
120 |
3,845 |
.. |
.. |
5,313 |
9,278 |
5.0% |
.. |
| PHC |
28,088 |
10,015 |
2,945 |
20,104 |
2,206 |
63,358 |
34.0% |
.. |
| Unreferred medical services |
10,565 |
.. |
.. |
804 |
1,294 |
12,663 |
6.8% |
20.0% |
| Dental services |
1,580 |
859 |
2,008 |
6,009 |
51 |
10,507 |
5.7% |
16.6% |
| Other health practitioners |
2,227 |
7 |
887 |
2,243 |
400 |
5,764 |
3.1% |
9.1% |
| Community health and other |
1,102 |
7,757 |
— |
147 |
230 |
9,236 |
5.0% |
14.6% |
| Public health |
1,311 |
1,393 |
.. |
23 |
158 |
2,885 |
1.6% |
4.6% |
| Benefit-paid pharmaceuticals |
10,615 |
.. |
.. |
1,458 |
.. |
12,073 |
6.5% |
19.1% |
| All other medications |
689 |
.. |
49 |
9,420 |
71 |
10,230 |
5.5% |
16.1% |
| Total health expenditure |
77,107 |
49,543 |
16,616 |
30,604 |
11,545 |
185,416 |
100% |
100% |
Note: Other services include patient transport services, administration, aids and appliances. Unreferred medical services includes spending on general practice services.
.., not applicable; –, rounded to 0; exp, expenditure; PHC, primary healthcare |
Analysing the funding sources for unreferred medical services shows that the Australian Federal Government contributes $10.56 billion dollars; $804 million is provided in patient contributions (out-of-pocket payments), with an additional $1.29 billion being delivered on behalf of workers’ compensation and third-party injury insurance. The $10.56 billion Federal Government contribution represents 13.7% of the Federal Government’s total contribution to health system funding. This provides funding for multiple PHC services: MBS- and DVA-funded GP services, MBS-funded general practice nurse and allied health services, government funding for Aboriginal Community Controlled Health Organisations (ACCHOs), PIP and Primary Health Networks (PHNs). The value of the Federal Government contribution to each component is not provided within the report. The percentage of total health expenditure allocated to each major health expenditure class and PHC subgroup is shown in Figure 1.
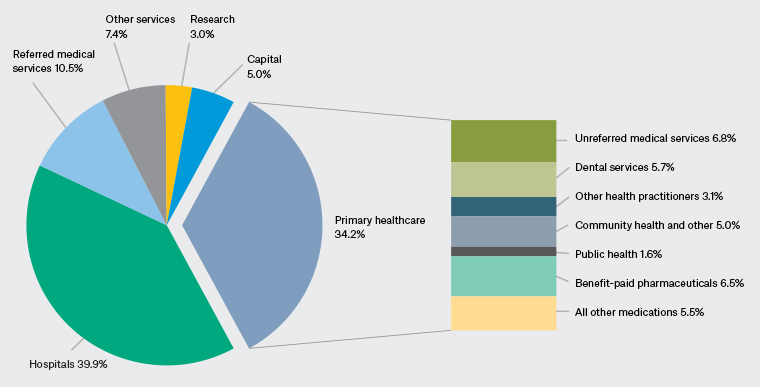
Figure 1. Classification of total health expenditure and breakdown of primary healthcare spending.15 Click here to enlarge
Medicare spending on GP services
The AIHW separately reports Medicare spending on GP services.16 In 2017/18, $7.8 billion was spent on MBS-subsidised GP attendances, with an additional $790 million in out-of-pocket expenses. Details of the MBS-subsidised services are summarised in Table 2.
| Table 2. Medicare spending on GP services (figures in $million)16 |
| |
Medicare spending |
| Fee-for-service GP consultation items |
5,500 |
| Enhanced Primary Care items (higher-value payments for patients with chronic and complex health conditions) |
1,470 |
| Service Incentive Payments within the Practice Incentives Program |
24 |
| GP after-hours care |
790 |
| Practice nurses, nurse practitioner, midwife and aboriginal health workers |
34 |
| Total |
7,818 |
| GP, general practitioner |
It should be noted that Service Incentive Payments (SIPs) were additional GP payments within PIP for meeting chronic disease management targets; these ended in 2018.
This report does not include DVA spending, nor bulk-billing incentive payments, nor PIP program payments made to practices. These three omitted elements (DVA, bulk-billing incentive and practice PIP payments) are all included in the AIHW health expenditure report and the RoGS.
RoGS-reported spending on GPs (and general practices)
The Productivity Commission’s RoGS17 provides further detail on spending allocated to GPs and practices. The RoGS reports that $9.77 billion was spent by the Australian Government on GPs in 2017–18. This figure includes MBS (including bulk-billing incentive payments), DVA, PIP and PHN spending. The RoGS quantifies $783 million of DVA spending on GP services, and $604 million for bulk-billing incentive (the majority of which is directed to GPs). The difference between the $7.8 billion reported in the Medicare spending report and the $9.77 billion reported in the RoGS includes these DVA and bulk-billing payments. The remaining $560 million is assumed to be related to PIP payments and PHN funding, but these payments are not quantified separately.
Extra information source: DHS Annual Report
The DHS 2017–18 Annual Report shows PIP payments totalling $342.9 million for the nearly 6000 participating practices.18 This spending is included in direct Medicare payments but not quantified in AIHW reports or the RoGS (other than $24 million in SIPs noted in the Medicare spending report).
Comparison of GP and PHC expenditure classifications
Table 3 shows different categories of primary care and GP spending included within classifications of each PHC-related report.
| Table 3. Classification of categories included within GP and PHC-related expenditure reports (figures in $million)15–17 |
| |
AIHW Medicare report |
RoGS |
AIHW health expenditure report |
| Medicare consultation services |
✓ |
✓ ? |
✓ ? |
| Enhanced Primary Care |
✓ |
✓ ? |
✓ ? |
| PIP (Service Incentive Payments) |
✓ |
✓ ? |
✓ ? |
| After-hours GP payments |
✓ |
✓ ? |
✓ ? |
| MBS-subsidised GP services |
7,794 |
✓ |
✓ ? |
| DVA spending on GP services |
❌ |
✓ |
✓ ? |
| Bulk-billing incentives |
❌ |
✓ |
✓ ? |
| Other – PHN and PIP spending |
❌ |
✓ ? |
✓ ? |
| Government spending on GPs |
|
9,777 |
|
| Other – ACCHO spending |
❌ |
❌ ✓ |
✓ ? |
| Out-of-pocket costs |
❌ |
❌ |
✓ |
| Workers’ compensation and third party |
❌ |
❌ |
✓ |
| Spending on unreferred medical services |
|
|
12,663 |
✓Indicates that a component is included within classification and quantified in report
✓? Indicates included in classification but not quantified in report
❌ Indicates not included within classification in report
❌✓ Indicates not included in classification but quantified in report
ACCHO, Aboriginal Community Controlled Health Organisation; AIHW, Australian Institute of Health and Welfare; DVA, Department of Veterans Affairs; GP, general practitioner; MBS, Medicare Benefits Schedule; PHC, primary healthcare; PHN, Primary Health Network; PIP, Practice Incentives Program; RoGS, Report on Government Services |
MBS-subsidised GP services are included in all reports, while government spending on GPs (in the RoGS and Australia’s health) also includes DVA spending, bulk-billing incentives, PIP spending and funding for PHNs. Health expenditure statistics also include patient contributions, ACCHO spending, workers’ compensation and third-party costs within spending on unreferred medical services. Different classifications result in differing ‘headline figures’ for GP-related spending, from 4.2% of health expenditure allocated to MBS-subsidised GP services, to 5.2% of health expenditure related to government spending on GPs, to 6.8% of total health expenditure spent on unreferred medical services. The reports differ in the detail provided.
Calculation using 2017/18 data
Table 4 shows 2017/18 GP- and PHC-related expenditure. This is calculated by combining the detail from the available data sources. In Table 4, values in parentheses indicate that a result is not provided within a given report but can be obtained from another source and assumed accurate and consistent. For example, DVA spending is included within unreferred medical attendances within the AIHW’s health expenditure report but not quantified, while the RoGS estimates $784 million DVA spending on GPs. PIP spending provided from the DHS 2017–18 Annual Report is shown in the far-right column (minus the $24 million from SIP funding). Precise spending on PHNs is not provided in any of the reports but calculated by comparing the various reporting lines.
| Table 4. GP and PHC-related expenditure comparison using 2017/2018 data (figures in $million)15–18 |
| |
AIHW
Medicare report |
RoGS |
AIHW health expenditure report |
DHS |
| Medicare consultation services |
5,508 |
|
|
319 |
| EPC |
1,472 |
|
|
| PIP (SIP)* |
24 |
|
|
| After-hours GP payments |
790 |
|
|
| Total MBS-subsidised GP services |
7,794 |
(7,794) |
(7,794) |
| DVA spending on GP services |
|
783 |
(783) |
| Bulk-billing incentive |
|
640 |
(640) |
| Other – PIP† |
|
(319) |
(319) |
| Other – PHN† |
|
(241) |
(241) |
| Total Government spending on GPs |
|
9,777 |
|
| Other – ACCHO spending‡ |
|
724 |
(724) |
| Total Government spending on GPs and ACCHO |
|
|
10,565 |
| Out-of-pocket costs |
|
|
804 |
| Workers’ compensation and third party |
|
|
1,294 |
| Other – unknown§ |
|
|
(64) |
| Total spending on unreferred attendances |
|
|
12,663 |
Note: Values in parentheses indicate that a result is not provided within a given report but can be obtained from another source and assumed accurate and consistent.
*The $24 million also included DHS PIP spend. This has been removed from DHS PIP value to avoid double counting.
†PHN and PIP spending is included within ‘Other spending’ in the RoGS and ABS reports, but the breakdown is not provided. PIP spending is reported within the DHS 2017–18 Annual Report. PHN spending is assumed but not directly reported after removing PIP spending from ‘Other spending’.
‡The RoGS reports a value of $724 million spent on Aboriginal primary care services separately to GP spending.
§$62 million of unreferred medical attendance spending is unable to be classified with the data sources used.
ABS, Australian Bureau of Statistics; ACCHO, Aboriginal Community Controlled Health Organisation; AIHW, Australian Institute of Health and Welfare; DHS, Department of Human Services; DVA, Department of Veterans Affairs; EPC, Enhanced Primary Care; GP, general practitioner; MBS, Medicare Benefits Schedule; PHC, primary healthcare; PHN, Primary Health Network; PIP, Practice Incentives Program; RoGS, Report on Government Services; SIP, Service Incentive Payment |
Discussion
This analysis highlights the complexity of health system funding and how minor classification differences have a significant impact on estimations of resource allocation. With multiple data sources providing inconsistent detail and classification of PHC spending, it is unsurprising that there is variation in reported general practice and PHC expenditure. Spending on GPs and general practice services varies between 4.2% and 6.8% of total health expenditure (between $7.8 billion and $12.4 billion) depending on the classification used.
Some potential misclassification of funding within unreferred medical services leads to overestimation of support for general practice services. For example, while PHNs provide some support to general practices, most of their funding is allocated to commissioning services in government priority areas (eg mental health, and alcohol and drug services). Many of these commissioned services require a referral and are not medical services (eg referred psychological services), so their inclusion within ‘unreferred medical services’ appears unusual. Clearer reporting of PHN spending is needed, with GP support and commissioning functions separated. As PHNs become involved in assisting practices in improving the quality of their data and initiatives such as delivering personal protective equipment during the pandemic, more precise quantification of PHN spending and its impact on improving general practice is needed.
As well as misclassification, inconsistencies exist in how components of PHC are reported and quantified. For example, Medicare-administered PIP provides support to general practices to improve the quality of care they provide. This spending is not included in Medicare statistics within Productivity Commission reporting, but it is included (although not quantified) within AIHW-reported spending on unreferred services.
Analysing expenditure is one way to assess health system performance.14 It is not possible to clearly evaluate the performance and outputs of the health system without clearly understanding the inputs used, and where they are allocated. PHC spending needs to be both 1) precisely defined and 2) regularly reported in order to monitor how health resources are being distributed. PHC spending is potentially less easily defined than health services provided either in a single location (eg a hospital) or with a single funding stream (eg a health district budget). PHC spending needs to be more precisely defined (either in terms of activity or service provider) and have an agreed classification. A first step towards better understanding of PHC costs would be for funders, providers and policymakers to reach an agreement about what constitutes general practice and PHC in Australia. Regular public reporting of PHC spending would then permit ongoing evaluation of efforts to increase general practice funding or to strengthen PHC.
Some professional groups are suggesting that expenditure targets for general practice and PHC spending are required.19 Before targets can be evaluated, an agreed PHC classification and a commitment to regular public reporting are both required. Agreed classification and transparent reporting are particularly important in a system where current policy changes will potentially have a substantive impact on not just the quantity of resources devoted to general practice and PHC, but also the method by which this sector is funded. For example, payments for MBS-funded telehealth during the pandemic (and payments proposed in the RACGP Vision) need to be monitored to understand whether funding represents additional PHC expenditure or a shift within current spending. Monitoring PHC spending may be more difficult in Australia than in countries with a single health funder, as responsibility for PHC is shared by multiple funders and jurisdictions.
This analysis examined direct Federal Government support to primary care services. State health departments also deliver community-based PHC services, which may offer some GP-type services. These services may represent additional support for primary care but have not been included in this analysis. The costs of delivering general practice services arguably includes costs related to referred investigations such as pathology and diagnostic imaging. These are classified within referred medical services, and it was not possible to determine whether this expenditure is related to GPs or other providers.
Conclusion
In order to make evidence-based and accurate decisions, governments and policymakers require accurate information and data. As health system reform resumes, informed by the impact of the COVID-19 pandemic, it will be increasingly important for Australia to quantify and clearly describe the distribution of health expenditure. Clearer classification and reporting of PHC spending is needed to better understand allocation of resources to general practice and PHC. Improved reporting will allow measurement, monitoring and evaluation of changes to health spending and encourage Australia’s limited health resources to be allocated efficiently and aligned with patient, provider and health system priorities.