Most Australian GPs are paid for their clinical services on a fee-for-service basis. Bulk-billed consultations are rebated to the GP directly by Medicare, the public insurer, and privately billed consultations are paid for by the patient, who claims a rebate from Medicare. In 2018, more than 95% of the Medicare Benefits Schedule items billed by GPs required a real-time face-to-face attendance.1,2
However, GPs often need to perform work outside of the consultation period. This work includes coordinating patient care (eg managing investigation results or liaising with specialists or patients’ families) or performing administrative tasks to meet personal and practice management requirements.3–5
In 2017, it was estimated that 20% of Australian GPs’ time is spent on this non-face-to-face work;6 however, previous studies have provided estimates ranging from zero hours to more than nine hours per week.5,7 Female practitioners report spending more time on these tasks, as do those managing patients who are elderly or have a chronic disease.5
Work outside of the consultation period is non-billable in a fee-for-service context. Clinicians, professional bodies and government advisors have acknowledged the burden of non-billable work.7–10 The Australian Medical Association (AMA) proposes that the current administrative workload represents an opportunity cost for more than 14 million face-to-face consultations per year.11 International literature shows that physicians with high administrative burdens have lower job satisfaction and are more likely to consider seeing fewer patients in the future.12–14
Currently, little is known about how Australian GPs’ non-billable work varies with different practice and practitioner characteristics.
The aim of this study was to 1) quantify the amount of time that GPs spent on work away from direct patient contact (‘non-billable work’), and 2) determine the practice and practitioner factors associated with this work.
Methods
Design
The study design was a secondary cross-sectional analysis of the Medicine in Australia: Balancing Employment and Life (MABEL) dataset. MABEL is a prospective longitudinal cohort study of practising Australian doctors. Detailed information on the MABEL protocol has been published elsewhere.15 MABEL surveys are available online (https://mabel.org.au).
Setting and participants
Participants were Australian GPs who responded to the 2016 MABEL survey. GPs were included if they were working ≥7.5 hours per week.
Variables
The main outcome variable was time spent on non-billable work. This was calculated by responses to a question ascertaining how many hours per week were spent on: 1) direct patient care, 2) indirect patient care and 3) administration and management. The survey question is shown in Figure 1.
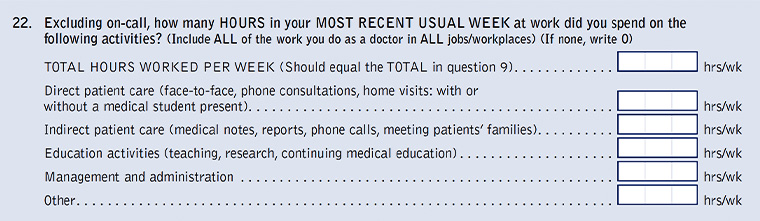
Figure 1. Medicine in Australia: Balancing Employment and Life (MABEL) Survey Wave 9, Question 22 examining general practitioners’ working hours.
Non-billable work was calculated by adding the hours attributed to ‘indirect patient care’ and ‘administration and management’ by the respondent. Total working hours were calculated by further adding hours attributed to ‘direct patent care’. Hours spent on ‘education activities’ were excluded from the calculation of ‘total working hours’.
Practitioner predictor variables were gender, age, Australian medical degree, GP college fellowship, total hours worked per week, income, business relationship with the practice, hospital responsibilities and bulk-billing proportion. Practice predictor variables comprised socioeconomic status of practice location, clinic size and rurality. Rurality was measured using the Australian Standard Geographical Classification.16
Analyses
The data were analysed using Stata 15 (Stata Corp College Station, Texas, USA).
Participants were excluded if the respondent had not answered the question regarding working hours. All regression analyses used the weighted dataset to adjust for response bias with respect to age, state, rurality, and whether the participant had received an incentive cheque.17 The researchers calculated actual hours of non-billable work, and then calculated non-billable work as a proportion of total working hours. Non-billable work proportion was converted into three ordinal categories of ‘less than 10%’, ‘between 10 and 20%’ and ‘more than 20%’ of total working hours.
Association of practice and practitioner factors with non-billable work
Univariate ordinal logistic regression was used to determine the independent variables associated with a higher category of non-billable work. Variables found to have a significant association (P ≤0.10) were tested for correlation. If two correlated variables affected the final multivariate model, one was excluded. The final multivariate ordinal logistic regression model included seven variables.
Ethics
The MABEL study was approved by the University of Melbourne Faculty of Economics and Commerce Human Ethics Advisory Group (Ref. 0709559), and the Monash University Standing Committee on Ethics in Research Involving Humans (Ref. CF07/1102 - 2007000291).
Results
In 2016, the MABEL survey was sent to 8118 GPs. Responses were received from 3325 (41%) clinically active GPs; of these, 2970 answered the survey question regarding working hours. Of these, 2907 GPs reported working more than 7.5 hours per week and were therefore included in the final cohort.
Tables 1 and 2 show the demographic data of respondents. The sample was broadly representative of the population of Australian GPs; however, participants were younger than average, with an overrepresentation of female GPs and GPs working in rural settings. Missing data were less than 5% for all variables, except age, which was missing 5.8%, and income, which was missing 15%.
| Table 1. Descriptive statistics of the sample – Part 1 |
| Variable |
Category |
Survey proportion (%) |
| Gender |
Female |
53 |
| Hospital work |
Yes |
22 |
| Fellowship of RACGP and/or ACRRM |
Yes |
58 |
| Location of primary medical degree |
Australia |
72 |
| AGSC rurality |
Major city |
61 |
| Inner regional |
23 |
| Outer regional, remote or very remote |
16 |
| Age |
<45 years |
40 |
| 45–59 years |
38 |
| ≥60 years |
22 |
| Job satisfaction |
Moderately or very satisfied |
90 |
| ACRRM, Australian College of Rural and Remote Medicine; AGSC, Australian Standard Geographical Classification; RACGP, The Royal Australian College of General Practitioners |
| Table 2. Descriptive statistics of the sample – Part 2 |
| Variable |
Mean (95% CI) |
SD |
Median (IQR) |
| Proportion of patients bulk billed (%) |
65.3 (64.1, 66.4) |
30.8 |
70 (40–95) |
| Number of GPs in the practice |
7.6 (7.5, 7.8) |
4.6 |
7.0 (4.0–10.0) |
| Total hours worked per week |
35.9 (35.4, 35.4) |
12.8 |
36.0 (26.0–43.0) |
| Non-billable hours worked per week |
5.1 (4.9, 5.3) |
5.3 |
4.0 (2.0–7.0) |
| Proportion time non-billable hours worked per week (%) |
14.2 (13.7, 14.6) |
12.9 |
12.5 (6.7–20.0) |
| CI, confidence interval; GP, general practitioner; IQR, interquartile range; SD, standard deviation |
Non-billable work
Respondents worked an average of 35.9 hours (95% confidence interval [CI]: 35.4, 36.4) per week (Figure 2). Of these, an average of 5.1 hours (95% CI: 4.9, 5.3), or 14.2% (95% CI: 13.7, 14.6), was spent on non-billable work.
Figure 2. Distribution of proportion of working hours as non-billable work as reported by Australian general practitioners (GPs).
A total of 9.3% of participants reported performing no hours of non-billable work.
Those working part time (<20 hours per week) performed a higher proportion of non-billable work (Table 3).
| Table 3. Amount and proportion of non-billable work per week by total weekly hours worked |
Total work
per week (hours) |
Number
of GPs |
Mean non-billable work per week (hours) (95% CI) |
Mean proportion non‑billable work per week (95% CI) |
| 7.5–19.9 |
418 |
2.6 (2.3, 2.9) |
16.6 (14.9, 18.2) |
| 20.0–29.9 |
592 |
3.7 (3.4, 3.9) |
14.2 (13.2, 15.1) |
| 30.0–39.9 |
1001 |
4.6 (4.3, 4.8) |
12.6 (11.9, 13.3) |
| ≥40.0 |
896 |
7.5 (7.0, 7.9) |
14.7 (14.0, 15.5) |
| Total |
2907 |
5.1 (4.9, 5.3) |
14.2 (13.7, 14.6) |
| CI; confidence interval; GP, general practitioner |
Association of practice and practitioner factors with non-billable work
The final multivariate model included seven variables that were shown to have an independent association with non-billable work hours: total working hours per week, gender, location of medical degree, college fellowship, business relationship with the practice, rurality and socioeconomic location. Working hours and ‘business relationship with the practice’ were included in the final analysis as confounders.
Income was not included in the final analysis because it was a cofactor with working hours, and bulk-billing status was also excluded as it had only a small association with the outcome and was also a cofactor with socioeconomic status.
The odds of a female GP having a greater proportion of her working hours devoted to non-billable work (being in a higher category of ‘lowest’, ‘middle’ or ‘highest’ cluster of non-billable work proportion) was 1.78 times (95% CI: 1.52, 2.09) that of a male GP (Table 4). Other practitioner factors significantly associated with non-billable work included being a graduate of an Australian medical school (OR: 1.43; 95% CI: 1.20, 1.70), having a college fellowship (OR: 1.21; 95% CI: 1.03, 1.41), or being a practice principal or partner, as opposed to a locum (OR: 0.46; 95% CI: 0.26, 0.81) or contracted GP (OR: 0.52; 95% CI: 0.42, 0.63).
| Table 4. The association between doctors spending a greater proportion of time on non-billable work and practitioner and practice factors: results from the multivariate ordinal logistic regression |
| Variable |
OR (95% CI) |
P value |
| Gender |
Male (ref) |
|
|
| Female |
1.78 (1.52, 2.09) |
<0.001 |
| Location of primary medical degree |
Overseas (ref) |
|
|
| Australia |
1.43 (1.20, 1.70) |
<0.001 |
| Business relationship with the practice |
Principal or partner (ref) |
|
|
| Associate |
0.81 (0.59, 1.11) |
0.19 |
| Salaried employee |
0.89 (0.66, 1.20) |
0.43 |
| Contracted employee |
0.52 (0.42, 0.63) |
<0.001 |
| Locum |
0.46 (0.26, 0.81) |
0.008 |
| Fellowship |
No fellowship (ref) |
|
|
| FRACGP and/or FACRRM |
1.21 (1.03, 1.41) |
0.02 |
| Rurality of practice |
Major city (ref) |
|
|
| Inner regional |
1.22 (1.00, 1.50) |
0.05 |
| Outer regional, remote or very remote |
1.52 (1.19, 1.93) |
0.001 |
| Socioeconomic area of practice |
First (most disadvantaged quintile) (ref) |
|
|
| Second |
1.00 (0.81, 1.25) |
0.95 |
| Third |
1.14 (0.90, 1.44) |
0.29 |
| Fourth |
1.40 (1.09, 1.79) |
0.008 |
| Fifth (least disadvantaged) |
1.41 (1.09, 1.83) |
0.009 |
Note: Values that are significant at the P <0.05 level are indicated in bold.
CI, confidence interval; FACRRM, Fellowship of the Australian College of Rural and Remote Medicine; FRACGP, Fellowship of The Royal Australian College of General Practitioners; OR, odds ratio; ref, reference variable |
Those working in outer regional, remote or very remote locations performed more non-billable work than those in major cities (OR: 1.52; 95% CI: 1.19, 1.93).
Age, concurrent hospital work and clinic size were not associated with non-billable work.
Discussion
On average, 14.2% (or 5.1 hours) of a GP’s working week was spent on non-billable work. This time varied significantly, with one in 11 respondents reporting no time spent on non-billable work, and one in four GPs spending more than 20% of their working hours on these tasks. Practitioner factors associated with non-billable work included having a college fellowship or Australian medical degree, being female, or working in a rural or higher socioeconomic area. The proportion of non-billable work was inversely proportional to total number of hours worked. This could be explained by GPs having to perform a minimum number of non-billable administrative tasks each week, regardless of the number of clinical hours they work.
Practice principals and partners performed more non-billable work than their ‘contracted employee’ or locum colleagues. This is an expected outcome, as principals will have to perform more administrative tasks to manage a practice; however, they will receive compensation for this extra time in the form of practice revenue.
Amount of non-billable work
The findings of the amount of non-billable work performed per week, and the wide inter-practitioner variability, tallies with prior Australian and international survey studies. A 2011 AMA survey estimated that GPs spend 4.6 hours per week on administration, but one in 10 reported more than nine hours per week.7 A substudy of the Bettering the Evaluation and Care of Health (BEACH) program in 2012–14 reported an average of 2.5 hours per week.5 Woolhandler and Himmelstein’s study of US primary care physicians found that 17.3% of their work was ‘patient care activities outside of office visits’ (termed ‘AOVs’) and that a higher amount of this work was associated with lower job satisfaction.14
However, the findings are lower than the estimates reported by several studies that used observational rather than self-reported methods to obtain data. Granja et al (Portugal), Gottschalk and Flocke (USA), Gilchrist et al (USA) and Chen et al (USA) all used time–motion analyses to collect data on family physicians’ activities.18–21 They estimated that AOVs and administration comprised 20–50% of primary care physician’s work. These contrasting results could be explained by their different healthcare systems, with greater administrative hours being a reflection of the time required to negotiate insurance paperwork. Their results may also be due to greater accuracy of their data collection tool, which eliminated recall bias.
Female practitioners
The present study concurs with existing literature that female GPs perform more non-billable work than their male colleagues.5,13 There may be several reasons for this: female GPs are more conscientious than their male colleagues22 and more likely to see female patients or manage psychological or social problems,23 factors previously identified as being associated with increased work outside the consultation.5
The finding that female GPs perform more non-billable work is significant in terms of the earning gap between male and female GPs of $83,000 per annum.22 While the reasons for this are likely multifactorial,22–24 the observed gender difference in the amount of non-billable work may offer a partial explanation.
Strengths
Strengths of the present study include the substantial sample size and the use of survey weights to examine data that are considered representative of the Australian GP cohort.15,17 This permits generalisability of the results. The comprehensive measures of non-billable work to include all tasks away from patient encounters allowed for analysis of many broad practitioner and practice factors affecting non-billable workloads.
Limitations
There are several limitations to the present study. Firstly, the self-reported survey data are subject to response bias. Those completing the 12-page MABEL survey may have been doctors more willing to perform non-clinical duties in the course of their normal work.
Second, the survey relied on doctors’ recall of their average working week. Accurate reporting of the sum of many short non-billable ‘events’ at the end of a week is likely challenging. The significant number of respondents (9.3%) who reported no hours of non-billable work reflects a possible construct error of the question. A similar error may have been a feature of the Henderson et al study of 1935 GPs, where 30.5% of respondents reported no non-billable events for 40 patients between subsequent encounters.5
Third, the study was unable to qualify the tasks performed during non-billable hours, reflecting that across the literature, there is no standard definition of the non-billable work that a GP performs. There is a broad range of patient, personal and practice tasks of both low and high value that would be performed during these hours.
Furthermore, while most Australian GPs work in a private practice, where the practice’s income is dependent on the fee-for-service model, on a personal level, GPs can earn their incomes in different ways.25 As principals, GPs own the practice and profit from its revenue; associates will typically earn a proportion of the return from each service, whereas salaried or contracted GPs might earn their income through salary, wages or sessional payments. The proportion of working hours spent on non-billable tasks may have different implications for some salaried or contracted GPs. However, most Australian GPs (86%) in 2017 were still remunerated via a proportion of billings,6 making the findings applicable to them.
The data are four years old. While 2018 MABEL survey data are currently available, there is no reason to believe that the findings would differ significantly.
Time spent on educational activities was not examined. The primary focus of the study was the relationship between clinical and administration hours worked by GPs. However, for some doctors, time spent on teaching, research or professional development is a significant component of their working week, and the distribution of their administration tasks would likely vary. Further studies could examine this data.
Finally, the survey question included telephone consultations in ‘direct patient care’, despite this being non-billable in 2016. This could have resulted in an underestimation of non-billable hours. However, there are limited data on the use of telephone consultations by GPs in 2016, so it is difficult to estimate the magnitude of the effect of this misclassification bias.
Conclusion
The results confirm that non-billable tasks account for a substantial component of Australian GPs’ work.
The extent of this non-billable work will likely increase with population ageing and rising comorbidity,26 while the workforce works less hours overall27 and becomes more feminised and more likely to hold a fellowship.6 However, it could also be expected that the wide use of telephone-based consultations from March 2020 may affect the efficiency of general practice for a period of time.
Going forward, it will be interesting to repeat this analysis to examine the impact of these ongoing transformations on the structure of a GP’s working day. Furthermore, research to explore the dynamics of GPs’ non-billable hours, identifying work that is of high value and components that are of low value, is also necessary.
Identifying how to reduce the burden of inefficient administration procedures, but fairly recognise and incentivise efficient and comprehensive primary care, will assist in maintaining the stability of the general practice workforce.