The COVID-19 pandemic has created uncertainty around work, safety and financial security, thereby impacting the mental health of the Australian community.1–6 By 30 March 2020, the Australian Government expanded Medicare-funded telehealth items to all Australians in response to the pandemic.7 Although there were initial declines in healthcare activities across New South Wales (NSW), an analysis of the ‘40 weeks of the pandemic year’ (January 2020 – October 2020) reported an increase in the number of mental health Medicare Benefits Schedule (MBS) services provided, supporting the significant mental health burden as a consequence of COVID-19.8,9
In March 2020, there was a 30% drop in face-to-face consultations and a rise in telehealth consultations across Australia.10 For example, a time series study of attendances at a regional Victorian Aboriginal Community Controlled Health Organisation saw a 27% increase in all attendances from March to June 2020, suggesting that telehealth availability allowed greater accessibility to medical services.11 Another study of changes due to telehealth use during the pandemic (to May 2020) found that women were generally higher users of health services and that this gender gap was greater for telehealth,12 calling for an evaluation into factors contributing to this divide. There is also a literature gap pertaining to the ongoing trends in modes of healthcare delivery that extend past the initial ‘first wave’ of COVID-19 in Australia (March – September 2020).
Given primary care’s frontline role in healthcare delivery and the rising mental health burden from COVID-19 restrictions, the aim of this study was to observe patterns in mental health attendances in a university-based community general practice in periods before, during and after the COVID-19 pandemic, specifically the distribution of face-to-face, telephone and televideo attendances. A secondary aim of the study was to explore the effects of age, ethnicity, birth sex and student status on presentation patterns. Given the temporary telehealth extension by the Australian Government in early 2022, the findings of this study will provide data for policy makers to consider the continuation and expansion of telehealth subsidisation.
Methods
Study design, population and settings
Retrospective data were obtained from patients attending a university-based community mixed-billing general practice in Sydney (NSW, Australia) during four 35-day time periods:
- T1: baseline, before COVID-19 (1 February – 7 March 2019)
- T2: during the first COVID-19 lockdown (31 March – 4 May 2020)
- T3: during the second COVID-19 lockdown (20 August – 23 September 2021)
- T4: after the last COVID-19 lockdown (1 February – 7 March 2022).
These time periods were chosen based on the National plan to transition Australia’s national COVID-19 response.13 T1 was chosen as the pre-COVID-19 baseline. Given that the general practice is a university-based practice, and students would not be on campus over their summer break, and that the practice itself is closed over the Christmas and New Year period, attendance during December and January may not have been an accurate representation of attendance. T2 and T3 reflected the COVID-19-associated lockdowns in Sydney at its strictest phase in 2020 and 2021, respectively. T4 reflected the ‘post-vaccination phase’, with the nationwide easing of restrictions. During the four time periods, 4505 participants were identified as attending the clinic. Participants who attended the clinic with eligible mental health MBS item numbers were identified via convenience sampling using the PenCS clinical audit tool (PenCS Pty Ltd, Sydney, NSW, Australia), a population–health platform used in Australian general practice. All study participants were aged ≥18 years. After application of the inclusion and exclusion criteria (age and MBS item number), 435 participants were included in the study.
Ethics approval for the study was granted by the Macquarie University Human Research Ethics Committee (Reference No. 520221129937092).
Study measures
Demographic and clinical characteristics
Demographic information, age, birth sex, ethnicity, student status, Kessler Psychological Distress Scale (K10) or Depression Anxiety Stress Scale – Short Form (DASS21) scores and presentation date were obtained from the electronic medical records.
MBS item numbers
Attendances defined by the following mental health MBS item numbers (consultations, care plans, care plan reviews) were obtained from the four time periods within the clinic database:
- face-to-face billing: Items 2700, 2701, 2712, 2713, 2715, 2717
- COVID-19 televideo billing: Items 92112, 92113, 92114, 92115, 92116, 92117
- COVID-19 telephone billing: Items 92124, 92125, 92126, 92127, 92128, 92129.
To control for staffing and clinic operating hours, the number of attendances was divided by the number of 30-minute appointment slots available in the relevant time period, with each MBS item number representing a unique attendance. This was defined as the ‘utilisation rate’ of all available appointments. The MBS defines televideo attendances as appointments conducted over videoconference, whereas telephone attendances are audio only. The term ‘telehealth’ used in this study includes both televideo and telephone attendances.
Statistical analysis
Data were extracted from the medical records using the PenCS clinical audit tool and were analysed using IBM SPSS Statistics version 27 (IBM Corp., Armonk, NY, USA). Descriptive statistics were generated for population demographics. Attendance per time period was analysed using Pearson Chi-squared tests. The utilisation rate per time period was analysed. Changes in K10 or DASS21 scores were analysed using one-way analysis of variance (ANOVA). Two-sided P<0.05 was considered statistically significant. Differences in utilisation rates were analysed according to age, birth sex, ethnicity and student status.
Results
Participants’ demographic and characteristics
In all, 435 participants were included in the study: 130, 60, 116 and 129 in T1, T2, T3 and T4, respectively (Table 1). Most participants during T1 (63.1%), T2 (61.7%) and T3 (43.1%) were aged 26–44 years, whereas most participants during T4 were aged 18–25 years (45.7%). In all time periods, female and White predominated. Most participants were students during T1 (59.2%), T3 (57.8%), and T4 (56.6%), whereas most were non-students in T2 (53.3%).
| Table 1. Participants’ demographic and clinical characteristics for T1, T2, T3 and T4 before, during and after the COVID-19 pandemic |
| |
T1 (n=130) |
T2 (n=60) |
T3 (n=116) |
T4 (n=129) |
| Age group (years) |
|
| 18–25 |
30 (23.1) |
13 (21.7) |
46 (39.7) |
59 (45.7) |
| 26–44 |
82 (63.1) |
37 (61.7) |
50 (43.1) |
49 (38.0) |
| 45–64 |
17 (13.1) |
7 (11.7) |
18 (15.5) |
17 (13.2) |
| ≥65 |
1 (0.8) |
3 (5.0) |
2 (1.7) |
4 (0.9) |
| Age (years) |
| Mean ±SD (range) |
31.4±9.8 |
35.2±12.8 |
32.4±11.7 |
29.7±11.3 |
| Range |
18–65 |
20–78 |
18–74 |
18–72 |
| Sex |
| Female |
89 (68.5) |
40 (66.7) |
79 (68.1) |
98 (76.0) |
| Male |
41 (31.5) |
20 (33.3) |
37 (31.9) |
31 (24.0) |
| Ethnicity |
|
| White |
81 (62.3) |
47 (78.3) |
81 (69.8) |
92 (71.3) |
| Other |
49 (37.7) |
13 (21.7) |
35 (30.2) |
37 (28.7) |
| Student status |
|
| Yes |
77 (59.2) |
28 (46.7) |
67 (57.8) |
73 (56.6) |
| No |
53 (40.8) |
32 (53.3) |
49 (42.4) |
56 (43.4) |
Unless indicated otherwise, data are presented as n (%).
SD, standard deviation; T1, before the COVID-19 pandemic (1 February – 7 March 2019); T2, during the first COVID-19 lockdown (31 March – 4 May 2020); T3, during the second COVID-19 lockdown (20 August – 23 September 2021); and T4, after the end of the COVID-19 lockdowns (1 February – 7 March 2022). |
Attendance according to time period
There were 1739, 1239, 1672 and 1824 30-minute appointment slots available during T1, T2, T3 and T4, respectively. The utilisation rate for mental health attendances during T1, T2, T3 and T4 was 7.5%, 4.8%, 6.9% and 7.1%, respectively (Figure 1), meaning there was a decline in mental health attendances from T1 to T2, which approached pre-COVID-19 levels during T4.
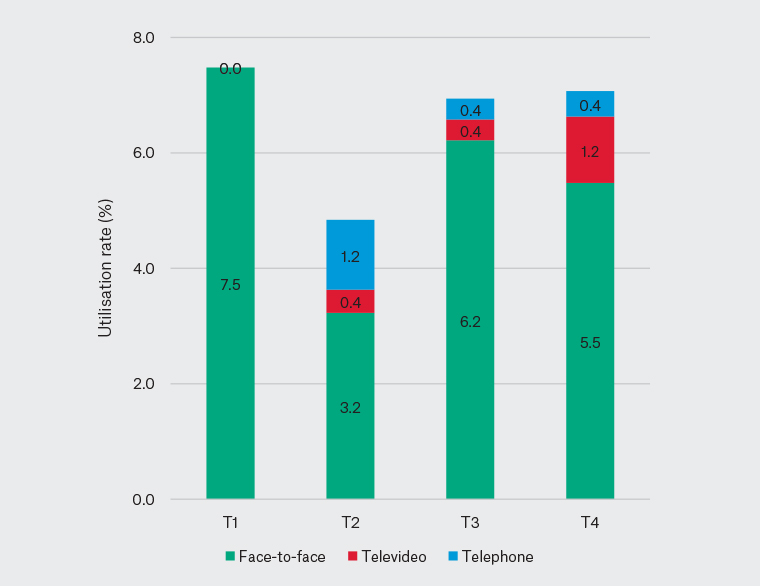
Figure 1. Utilisation rate of face-to-face, televideo, telephone attendances during T1 (1 February – 7 March 2019), T2 (31 March – 4 May 2020), T3 (20 August – 23 September 2021) and T4 (1 February – 7 March 2022).
The utilisation rate of face-to-face attendances decreased from 7.5% in T1 to 3.2% in T2. The utilisation rate of face-to-face attendances remained lower during T3 (6.2%) and T4 (5.5%). The utilisation rate of televideo attendances increased from 0.4% in T2 to 1.2% in T4, with a concomitant decrease in the utilisation rate of telephone attendances from 1.2% (T2) to 0.4% (T4). However, the total rate of telehealth attendances remained similar (at 1.6%) in T2 and T4.
Attendance according to age, sex, ethnicity and student status
Most patients presenting for face-to-face and telephone attendances were aged 26–44 years, whereas most of those presenting for televideo attendances were aged 18–25 years (P=0.022 between groups; Table 2). Females were the main sex for all attendance types (P=0.046 versus males). There were no significant differences in attendance type according to ethnicity or student status.
| Table 2. Number of mental health attendances for face-to-face, televideo and telephone consultations according to age, gender, ethnicity and student status |
| |
MBS category |
P-value |
| Face-to-face |
Televideo |
Telephone |
| Age group (years) |
|
|
|
|
| 18–25 |
127 (34.0) |
16 (50.0) |
5 (17.2) |
0.022 |
| 26–44 |
193 (51.6) |
11 (34.4) |
14 (48.3) |
|
| 45–64 |
45 (12.0) |
5 (15.6) |
9 (31.0) |
|
| ≥65 |
9 (2.4) |
0 |
1 (3.4) |
|
| Sex |
| Female |
245 (67.9) |
31 (81.6) |
30 (83.3) |
0.046 |
| Male |
116 (32.1) |
7 (18.4) |
6 (16.7) |
|
| Ethnicity |
| White |
244 (67.6) |
28 (73.7) |
29 (80.6) |
0.257 |
| Other |
117 (32.4) |
10 (26.3) |
7 (19.4) |
|
| Student status |
|
|
|
|
| Yes |
208 (57.6) |
22 (57.9) |
15 (41.7) |
0.064 |
| No |
153 (42.4) |
16 (42.1) |
21 (58.3) |
|
Unless indicated otherwise, data are presented as n (%).
MBS, Medicare Benefits Schedule. |
Attendance according to appointment length
The association between appointment length and time period just reached statistical significance (P=0.049). During T1, most face-to-face attendances were for review (54.6%), followed by appointments 20–40 and >40 minutes in duration (36.9% and 8.5%, respectively; Figure 2). These percentages changed during both lockdowns (T2 and T3); there was a decrease in 20- to 40-minute consultations from 36.9% (T1) to 22.5% (T2) and 26.0% (T3) and an increase in >40-minute consultations from 8.5% (T1) to 15.0% (T2) and 20.2% (T3). Face-to-face >40-minute consultations during T4 accounted for 12.0% of attendances.
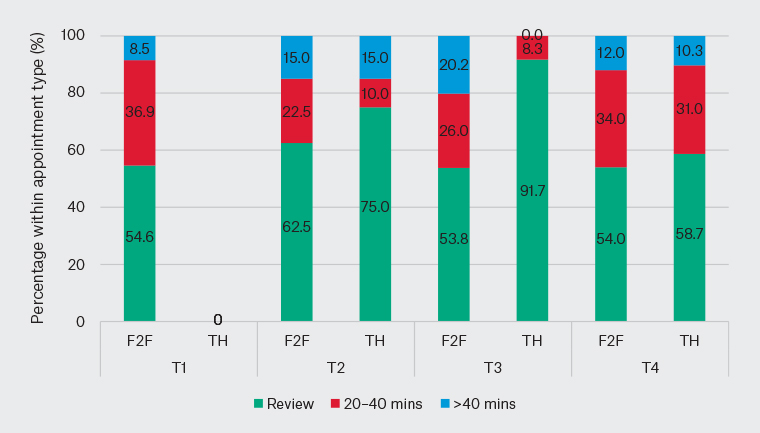
Figure 2. Mental health attendances for face-to-face (F2F) and telehealth (TH) consultations during T1 (1 February – 7 March 2019), T2 (31 March – 4 May 2020), T3 (20 August – 23 September 2021) and T4 (1 February – 7 March 2022) according to appointment length.
During T2, most telehealth attendances were for review (75.0%), followed by appointments >40 and 20–40 minutes in duration (15.0% and 10.0%, respectively). This distribution changed during T3, with most appointments being for review (91.7%). However, by T4, the distribution pattern of >40 minutes, 20–40 minutes and review appointments for telehealth appointment lengths was similar to face-to-face.
Attendances according to K10 and DASS21 scores
There were no significant differences in psychological distress scores and time period. During T1, T2, T3 and T4, the mean K10 scores were 26.5 (n=130), 23.2 (n=60), 20.3 (n=116) and 25.0 (n=129), respectively (Figure 3). DASS21 scores were highest in T2, and ‘stress’ remained the highest-scoring DASS21 category for all time periods, although these were not statistically significant between time periods (Figure 3).
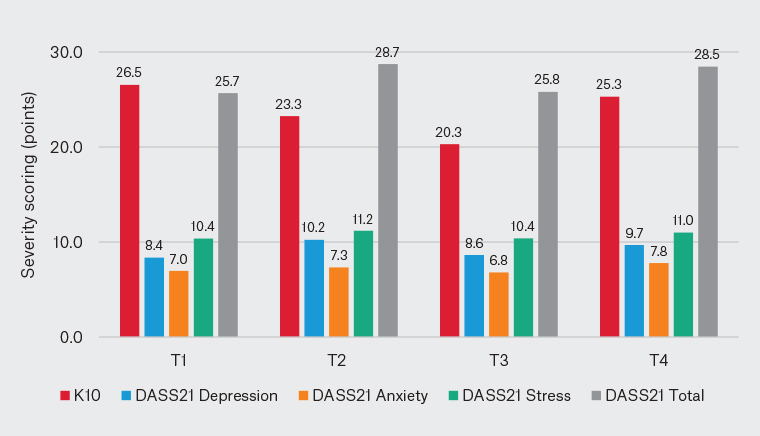
Figure 3. Mean K10 and DASS21 severity scoring during T1 (1 February – 7 March 2019), T2 (31 March – 4 May 2020), T3 (20 August – 23 September 2021) and T4 (1 February – 7 March 2022).
K10, Kessler Psychological Distress Scale; DASS21, Depression Anxiety Stress Scale – Short Form.
Discussion
Although there was a decline in overall mental health attendances during the first COVID-19 lockdown, mental health attendances returned to close to pre-COVID-19 levels during the post-lockdown period. There was a decrease in face-to-face attendances and an increase in telehealth activity compared with pre-COVID-19 levels, with the latter still being a significant modality in 2022. The persistent utilisation of telehealth services may indicate an interest in and acceptance of this form of mental healthcare delivery.
The utilisation rate of face-to-face attendances decreased from 7.5% in T1 to 3.2% during the first COVID-19 lockdown (T2), and remained lower (at 5.5%) during T4. Factors such as patients being unable to physically present due to COVID-19 infection or students attending services elsewhere due to campus closure may have contributed to this decline in face-to-face attendances. The utilisation rate of telephone attendances increased from 0% (T1) to 1.2% during the first COVID-19 lockdown (T2), and remained at 0.4% during T4. Despite these trends, face-to-face attendances remained the main form of delivery, possibly due to factors such as the clinic remaining open during the lockdown periods and patients’ personal preferences. An Australian nationwide study found an overall increase in general practice telehealth activity from March 2019 to March 2020, with telephone attendances increasing from 0% to 34%.14 Although the present study only focused on mental health attendances, it highlights the importance of reviewing telehealth activity after the initial lockdown. In the present study, the utilisation rate of televideo attendances increased from T2 (0.4%) to T4 (1.2%). An Australian nationwide survey study found that general practitioners (GPs) who had videoconferencing infrastructure or prior experience were more likely to use televideo than GPs who did not.15 Managerial support, organisational networks and shifts in medical culture were also valuable in the use of telehealth as a mode of care.16 The increased rate of televideo utilisation in the present study may be attributed to initial learning and resource barriers during the first COVID-19 lockdown, which were mitigated by the second lockdown and after lockdown. Previous studies also identified ongoing government investment in primary care telehealth subsidisation as a factor in the continued use of telehealth.15,17,18
Although the overall percentage of review and 20- to 40-minute face-to-face attendances decreased from T1 to T4, the distribution of reviews, 20- to 40-minute and >40-minute attendances was similar between the face-to-face and telehealth modes of delivery by T4. The changes in attendance type and duration highlight the potential for longitudinal delivery of mental healthcare via telehealth. Individuals may use telehealth for smaller issues but prefer face-to-face consultations for more complex presentations that require longer appointment times. A study found that GPs who saw older patients were less likely to use telehealth, whereas those who saw complex patients were more likely to use telehealth.15 Therefore, there are many factors contributing to the use of telehealth. A systematic review revealed that televideo and telephone consultations were as effective as face-to-face consultations in terms of patient satisfaction and therapeutic alliance.19 However, there was a higher rate of care discontinuation with telehealth consultations due to loss to follow‑up.19 Future research should examine long-term clinical outcomes associated with attendance types, such as patients’ mental health status, patient–clinician satisfaction with attendance type and service efficiency. This may assist policy makers to revisit the services subsidisation in current models of care.
The present study showed that adults (aged 26–44 years) accounted for the majority of overall mental health attendances, whereas young adults (aged 18–25 years) accounted for the majority of televideo mental health attendances. There was also a significant association between mental health attendance and female gender. A cross-sectional survey on Australian university students revealed that female gender was associated with lower wellbeing during the first few months of the COVID-19 pandemic.2 In contrast, a 2020 study found that age, gender and education level did not significantly predict negative wellbeing.4 The influence of socioeconomic factors on mental health are complex, and reporting ‘lower wellbeing’ may not necessarily translate to a mental health attendance. Young adults who had secure employment had better mental health than those who had less secure employment.20 The present study had a small sample of older adults (aged ≥65 years), potentially due to practice location and barriers noted in the literature among the elderly, such as difficulty recognising milder mental health concerns and having a high value of self-sufficiency.21 A study during the first COVID-19 lockdown in Sydney showed that 63% of older adults used technologies to connect with others.22 This may indicate a promising void that telehealth can fill in the older population given the resources and access. Increasing access to mental health services in the community, such as maintaining telehealth availability, should be an important policy goal.
Strengths and limitations
The strengths of this study included having time periods that reflect the Australian Government’s National plan to transition Australia’s national COVID-19 response, and extended past the initial COVID-19 ‘wave’. The observational nature of the study may limit the applicability of these results. As a community university-based practice, the population group may be more computer literate and tertiary educated than groups in other geographical areas. Ethnic diversity was also limited. In Sydney, lockdown restrictions and lengths differed according to geographic location. Consequently, the results of the present study may not be generalisable to the Australian population and to other non-university-based practices. Mental-health issues are commonly discussed at other non-mental health-billed consultations; therefore, the volume of mental health attendances may have been underestimated. This draws attention for further research into factors that have not shown significant results, and an examination of clinical outcomes from face-to-face and telehealth mental health attendances.
Conclusion
Although the present study showed similar mental health attendances after the COVID-19 lockdowns (T4), telehealth has become a mainstream healthcare tool, with face-to-face attendances having declined to 5.5% and telehealth attendances remaining at 1.6%.