In March 2016, new direct-acting antivirals (DAAs) for chronic hepatitis C virus (HCV) were added to the Pharmaceutical Benefits Scheme (PBS) and replaced interferon-based therapies as first-line treatment.1 Prior to this, DAAs were only available through pharmaceutical trials.2 DAAs are oral therapies with fewer side effects, shorter treatment duration and a greater than 90% cure rate.2
It was estimated that 188,770 Australians were living with HCV at the start of 2016,3 and approximately half were treated by the end of 2020.4 This is linked to an approximate 20% decline in deaths from HCV-related liver failure and hepatocellular carcinoma, in contrast to previous trends.5 However, yearly treatment numbers have decreased over time, from 32,049 in 2016 to 8140 during 2020, and more than 300 individuals still die due to HCV each year in Australia.4 A recent study estimated that HCV testing and treatment in Australia needs to increase by 50% to meet the World Health Organization targets for elimination.6
The prevalence of HCV is estimated to be higher in rural and regional areas than in metropolitan areas.4 Treatment uptake also varies by region, and has been highest in inner regional areas and lowest in remote and very remote areas.4 Similarly, health service access varies by remoteness, and HCV DAAs in particular have high cost outlays that may limit availability in pharmacies outside of major centres.7,8
Currently, there are no population-level analyses of treatment completion in Australia, and uptake measures are generally based on initiations that do not account for cessation prior to completion.4,9 The aim of this study was to explore disparities in HCV treatment completion according to various factors, using PBS dispensing data. The Australasian Hepatology Association consensus guidelines recommend dispensing records as an evidence-based method of evaluating DAA treatment completion,10 and a similar approach has previously been used in the Australian context for hepatitis B.11 In this study, we analysed PBS claims, which cover all Australians provided treatment through Medicare, from March 2016 to June 2019. The objective was to investigate DAA treatment completion by remoteness and subsequently identify contributing determinants among sex, age, state, treatment duration and prescriber type.
Methods
Data source
All DAA prescription data from 1 March 2016 to 30 June 2019 were requested from Services Australia. Patients were anonymised using a unique numerical identifier, and data were provided in line-listed format allowing longitudinal assessment of treatment patterns. Variables included date of supply, PBS item code (specific to each drug or drug combination and duration), prescriber type, state, remoteness area of residence, age group and sex (Appendix 1; available online only). To prevent potential re-identification, reported data were suppressed where the number of individuals in any group was less than six (indicated in results tables).
Geographic designations and patient age (stratified into groups by Medicare) were based on patient residence recorded by Medicare at the time of dispensing. The time period was based on the month of first prescription dispensing. Prescriber type is derived by Medicare based on a practitioner’s service history, grouped as general practitioner (GP), specialist or ‘other’ (which includes nurse practitioners, temporary resident doctors and others unable to be classified). Prescriber type was assigned using the prescriber of the first prescription dispensed.
Treatment completion
Treatment completion was assumed if the full number of expected DAA prescriptions was dispensed to complete the course as specified by the PBS item number (Appendix 1).8,12
For example, a 12-week course requires three 1-month repeats, and so was considered complete if all three repeats were dispensed.8 This is inclusive of prescriptions endorsed to allow all repeats to be supplied at once.13 Non-completeness was assumed if less than the expected number of prescriptions was dispensed or more than 30 days elapsed between the expected and observed date of course completion, and completion was calculated for the patient’s first course only. Patients were excluded if completeness could not be assessed because their course would have ended after 30 June 2019.
Statistical analysis
Raw data were provided and managed in Microsoft (Bellevue, WA, USA) Excel. Treatment completion (see above) was determined using SPSS version 26 (IBM Corp., Armonk, NY, USA). The number of patients who completed treatment was assessed as a proportion of the total number of patients who started treatment, according to age, sex, state, prescriber type, treatment duration and time period, stratified by remoteness classification. Detailed analyses of patients and factors associated with treatment completion were focused on very remote areas due to the considerably lower treatment completion in these regions.
Treatment completion outcomes were analysed according to the above categories using Stata v14.2 (StataCorp, College Station, TX, USA) by univariate logistic regression analysis to assess factors associated with completion, with data reported as odds ratios (ORs) with 95% confidence intervals (CIs) and statistical significance set at P < 0.05. Within remoteness, age group, sex, state, prescriber type and treatment duration, the variable with the greatest number of patients within that category was used as the comparator. For time periods, March – June 2016 was used as the comparator.
Ethics statement of compliance
This research was approved by the University of Notre Dame Human Research Ethics Committee (Ref. 019131S).
Results
Patient characteristics
Overall, 68,940 individuals initiated DAA medications between 1 March 2016 and 30 June 2019 (Table 1) in Australia. For all remoteness classifications, the number of patients initiating treatment decreased over time (Table 1). Patients were mostly aged between 50 and 59 years (32.3%) and male (67.4%; Table 1). This was reflected across all remoteness classifications. Most patients (79.4%) underwent a 12-week treatment duration, and the most common prescribers were specialists (50.8%), followed by GPs (32.7%; Table 1). This was reflected across all remoteness classifications except for remote areas, where GPs were the majority prescriber (50% of patients; Table 1).
| Table 1. Number and proportion of patients by age, sex, state, prescriber type and treatment duration stratified by remoteness classification |
| |
Australia |
Major cities |
Inner regional |
Outer regional |
Remote |
Very remote |
| n (% of total) |
n (% of total) |
n (% of total) |
n (% of total) |
n (% of total) |
n (% of total) |
| Total |
68,940 (100) |
46,115 (100) |
15,459 (100) |
6529 (100) |
580 (100) |
257 (100) |
| Age (years) |
|
| 0–19 |
194 (0.3) |
129 (0.3) |
51 (0.3) |
12 (0.2) |
* |
* |
| 20–29 |
4328 (6.3) |
2581 (5.6) |
1235 (8) |
441 (6.8) |
54 (9.3) |
17 (6.6) |
| 30–39 |
12,654 (18.4) |
8542 (18.5) |
2794 (18.1) |
1165 (17.8) |
114 (19.7) |
39 (15.2) |
| 40–49 |
12,654 (26) |
12,208 (26.5) |
3942 (25.5) |
1593 (24.4) |
140 (24.1) |
66 (25.7) |
| 50–59 |
22,266 (32.3) |
14,769 (32) |
5003 (32.4) |
2231 (34.2) |
174 (30) |
89 (34.6) |
| ≥60 |
11,549 (16.8) |
7886 (17.1) |
2434 (15.7) |
1087 (16.6) |
97 (16.7) |
45 (17.5) |
| Sex |
| Male |
46,479 (67.4) |
30,859 (66.9) |
10,549 (68.2) |
4495 (68.8) |
391 (67.4) |
185 (72) |
| Female |
22,461 (32.6) |
15,256 (33.1) |
4910 (31.8) |
2034 (31.2) |
189 (32.6) |
72 (28) |
| State |
| Victoria |
18,016 (26.1) |
13,618 (29.5) |
3589 (23.2) |
809 (12.4) |
* |
* |
| NSW |
23,441 (34) |
15,416 (33.4) |
6342 (41) |
1573 (24.1) |
109 (18.8) |
1 (40) |
| WA |
5696 (8.3) |
4271 (9.3) |
553 (3.6) |
625 (9.6) |
135 (23.3) |
112 (43.6) |
| Queensland |
14,283 (20.7) |
8665 (18.8) |
3426 (22.2) |
2027 (31) |
58 (10) |
107 (41.6) |
| ACT |
1037 (1.5) |
1037 (2.2) |
* |
* |
* |
* |
| SA |
4208 (6.1) |
3108 (6.7) |
327 (2.1) |
591 (9.1) |
182 (31.4) |
* |
| NT |
519 (0.8) |
* |
* |
386 (5.9) |
96 (16.6) |
37 (14.4) |
| Tasmania |
1740 (2.5) |
* |
1222 (7.9) |
518 (7.9) |
* |
* |
| Prescriber type |
| Specialist |
35,018 (50.8) |
24,251 (52.6) |
7603 (49.2) |
2894 (44.3) |
169 (29.1) |
101 (39.3) |
| GP |
22,526 (32.7) |
14,361 (31.1) |
5316 (34.4) |
2475 (37.9) |
290 (50) |
84 (32.7) |
| Other |
11,246 (16.3) |
7404 (16.1) |
2507 (16.2) |
1142 (17.5) |
121 (20.9) |
72 (28) |
| Unknown |
150 (0.2) |
99 (0.2) |
33 (0.2) |
18 (0.3) |
* |
* |
| Treatment duration (weeks) |
| 8 |
7508 (10.9) |
4561 (9.9) |
1948 (12.6) |
901 (13.8) |
73 (12.6) |
25 (9.7) |
| 12 |
54,754 (79.4) |
37,050 (80.3) |
11,992 (77.6) |
5045 (77.3) |
465 (80.2) |
202 (78.6) |
| 16 |
187 (0.3) |
133 (0.3) |
38 (20) |
11 (0.2) |
5 (90) |
* |
| 24 |
6491 (9.4) |
4371 (9.5) |
1481 (96) |
572 (8.8) |
37 (6.4) |
30 (11.7) |
| Time period |
| March – June 2016 |
16,385 (23.8) |
11,485 (24.9) |
3165 (20.5) |
1575 (24.1) |
100 (17.2) |
60 (23.3) |
| July – December 2016 |
13,920 (20.2) |
9151 (19.8) |
3298 (21.3) |
1291 (19.8) |
131 (22.6) |
49 (19.1) |
| January – June 2017 |
10,360 (15) |
6785 (14.7) |
2424 (15.7) |
1023 (15.7) |
92 (15.9) |
36 (14) |
| July – December 2017 |
10,049 (14.6) |
6747 (14.6) |
2270 (14.7) |
894 (13.7) |
98 (16.9) |
40 (15.6) |
| January – June 2018 |
7608 (11) |
4947 (10.7) |
1780 (11.5) |
771 (11.8) |
72 (12.4) |
38 (14.8) |
| July – December 2018 |
7328 (10.6) |
4849 (10.5) |
1738 (11.3) |
660 (10.1) |
56 (9.7) |
25 (9.7) |
| January – June 2019 |
3290 (4.8) |
2151 (4.7) |
784 (5.1) |
315 (4.8) |
31 (5.3) |
9 (3.5) |
*Data suppressed where the number of patients was less than six; totals may not add up due to this inclusion.
ACT, Australian Capital Territory; GP, general practitioner; NSW, New South Wales; NT, Northern Territory; SA, South Australia; WA, Western Australia. |
Treatment completion in Australia
Overall, 85.6% of patients were categorised as having completed treatment (Table 2). Patients in very remote areas had the lowest treatment completion rate (74.3%; OR 0.52; 95% CI: 0.95, 0.7; P < 0.005), followed by patients in outer regional areas (84.1%; OR 0.89; 95% CI: 0.83, 0.96; P < 0.005), compared with those in major cities (85.9%; Table 2). Patients in Queensland (82%; OR 0.76; 95% CI: 0.72, 0.81; P < 0.005) and Western Australia (WA; 82.5%; OR 0.81; 95% CI: 0.75, 0.88; P < 0.005) had the lowest treatment completion rate (Table 3).
| Table 2. Treatment completion nationally and stratified by remoteness classification |
| |
No. (%) adherent |
OR (95% CI) |
P-value |
| Australia |
59,017 (85.6) |
* |
* |
| Remoteness classification |
|
|
|
| Major cities |
39,624 (85.9) |
Comparator |
Comparator |
| Inner regional |
13,222 (85.5) |
1.01 (0.95, 1.07) |
0.749 |
| Outer regional |
5489 (84.1) |
0.89 (0.83, 0.96) |
<0.005 |
| Remote |
491 (84.7) |
1.04 (0.82, 1.32) |
0.746 |
| Very remote |
191 (74.3) |
0.52 (0.39, 0.7) |
<0.005 |
*National data not assessed for statistical significance.
CI, confidence interval; OR, odds ratio. |
For all remoteness classifications, treatment completion declined from March 2016 to June 2019 (Figure 1). Very remote areas saw the largest proportional decrease in treatment completion, from 83.3% to 55.6% (compared with the national decline from 91.8% to 76.1%; Table 4), although this was not statistically significant, likely due to low numbers (P = 0.258).
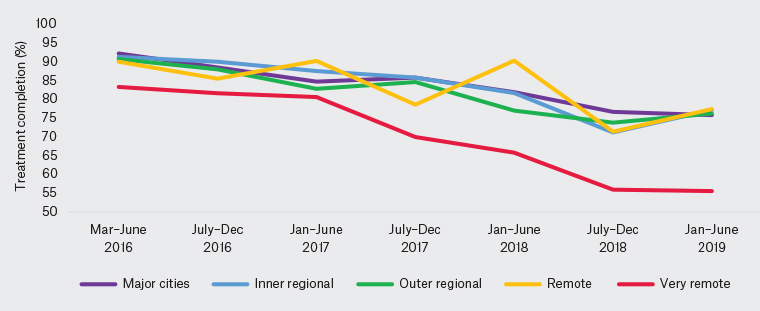 Figure 1. Proportion of patients with treatment completion by time period and remoteness classification.
Nationally, patients aged 0–19 years had lower treatment completion rates (71.1%; OR 0.36; 95% CI: 0.26, 0.49; P < 0.005) than those aged 50–59 years (88.8%; Table 3); however, this represented only a small proportion of patients (<0.25%; Table 1). In all remoteness classifications, completion was highest in patients aged 50–59 and ≥60 years (Appendix 2; available online only).
| Table 3. Treatment completion in Australia stratified by age, sex, state, prescriber type, treatment duration and time period |
| |
No. (%) adherent |
OR (95% CI) |
P-value |
| Age group (years) |
| 0–19 |
138 (71.1) |
0.36 (0.26, 0.49) |
<0.005 |
| 20–29 |
3107 (71.8) |
0.37 (0.34, 0.4) |
<0.005 |
| 30–39 |
10,322 (81.6) |
0.6 (0.56, 0.63) |
<0.005 |
| 40–49 |
15,291 (85.2) |
0.77 (0.72, 0.81) |
<0.005 |
| 50–59 |
19,770 (88.8) |
Comparator |
Comparator |
| ≥60 |
11,549 (90) |
1.12 (1.04, 1.21) |
<0.005 |
| Sex |
| Male |
39,488 (85) |
Comparator |
Comparator |
| Female |
19,529 (86.9) |
1.1 (1.05, 1.15) |
<0.005 |
| State |
| NSW |
20,348 (86.8) |
Comparator |
Comparator |
| WA |
4699 (82.5) |
0.81 (0.75, 0.88) |
<0.005 |
| Queensland |
11,711 (82) |
0.76 (0.72, 0.81) |
<0.005 |
| NT |
457 (88.1) |
1.2 (0.9, 1.59) |
0.21 |
| SA |
3599 (85.5) |
0.85 (0.77, 0.94) |
<0.005 |
| Victoria |
15,736 (87.3) |
1.03 (0.97, 1.1) |
0.267 |
| Tasmania |
1543 (88.7) |
1.32 (1.13, 1.55) |
<0.005 |
| ACT |
924 (89.1) |
1.18 (0.96, 1.44) |
0.119 |
| Prescriber |
| Specialist |
30,861 (88.1) |
Comparator |
Comparator |
| GP |
18,484 (82.1) |
0.78 (0.74, 0.82) |
<0.005 |
| Unknown |
142 (94.7) |
2.32 (1.13, 4.79) |
0.022 |
| Other |
9530 (84.7) |
0.91 (0.86, 0.97) |
<0.005 |
| Treatment duration (weeks) |
| 8 |
6062 (80.7) |
0.91 (0.85, 0.98) |
0.007 |
| 12 |
47,558 (86.9) |
Comparator |
Comparator |
| 16 |
102 (54.5) |
0.21 (0.16, 0.29) |
<0.005 |
| 24 |
5295 (81.6) |
0.36 (0.34, 0.39) |
<0.005 |
| Time period |
| March – June 2016 |
15,045 (91.8) |
Comparator |
Comparator |
| July – December 2016 |
12,354 (88.8) |
0.70 (0.64, 0.75) |
<0.005 |
| January – June 2017 |
8824 (85.2) |
0.53 (0.49, 0.57) |
<0.005 |
| July – December 2017 |
8601 (85.6) |
0.52 (0.48, 0.56) |
<0.005 |
| January – June 2018 |
6191 (81.4) |
0.38 (0.35, 0.42) |
<0.005 |
| July – December 2018 |
5497 (75) |
0.27 (0.25, 0.3) |
<0.005 |
| January – June 2019 |
2505 (76.1) |
0.29 (0.26, 0.32) |
<0.005 |
| ACT, Australian Capital Territory; CI, confidence interval; GP, general practitioner; NSW, New South Wales; NT, Northern Territory; OR, odds ratio; SA, South Australia; WA, Western Australia. |
Treatment completion was higher among women (86.9%; OR 1.1; 95% CI: 1.05, 1.15; P < 0.005) than men (85%; Table 3), and this was seen across all remoteness classifications except for remote and very remote areas, where there was no evidence of treatment completion being lower among men (Appendix 2).
Treatment completion was higher among patients treated by specialists (88.1%) than GPs (82.1%; OR 0.78; 95% CI: 0.74, 0.82; P < 0.005) nationally and in all remoteness classifications except remote areas (Appendix 2). Patients undergoing 16 weeks of treatment had the lowest completion rate in all remoteness classifications, but this represented a low number of patients (Table 3). Those receiving 8 weeks of treatment had lower treatment completion rates (80.7%; OR 0.91; 95% CI: 0.85, 0.98; P = 0.007) than those receiving 12 weeks of treatment (86.9%; Table 3), and this was consistent across remoteness areas (Appendix 2).
Treatment completion in very remote areas
In very remote areas, 257 patients started treatment (Table 1). Similar to Australia overall, most patients were aged 50–59 years (34.6%) and were male (72%; Table 1). Most patients in very remote areas resided in WA (n = 112) or Queensland (n = 107; Table 1). Treatment completion was lowest in very remote areas across all states with these areas (Appendix 2). Subgroup analysis of the very remote areas found that patients treated by GPs had significantly lower treatment completion rates (66.7%; OR 0.47; 95% CI: 0.22, 0.97; P = 0.042) than those treated by specialists (81.2%; Table 4). In addition, within the very remote areas, patients aged 30–39 years (56.4%, P = 0.088), female (70.8%, P = 0.604) and undergoing 8 weeks of treatment (64%, P = 0.828) had the lowest treatment completion rates, although results were not statistically significant using the logistic regression model (Table 4).
| Table 4. Treatment completion in very remote areas stratified by age, sex, state, prescriber type, treatment duration and time period |
| |
No. (%) adherent |
OR (95% CI) |
P-value |
| Age group (years) |
| 0–19 |
* |
* |
* |
| 20–29 |
11 (64.7) |
0.89 (0.26, 3.03) |
0.850 |
| 30–39 |
22 (56.4) |
0.45 (0.18, 1.13) |
0.088 |
| 40–49 |
50 (75.8) |
1.19 (0.53, 2.66) |
0.670 |
| 50–59 |
69 (77.5) |
Comparator |
Comparator |
| ≥60 |
38 (84.4) |
1.9 (0.71, 5.07) |
0.203 |
| Sex |
| Male |
140 (75.7) |
Comparator |
Comparator |
| Female |
51 (70.8) |
0.84 (0.43, 1.63) |
0.604 |
| State |
| NSW |
* |
* |
* |
| WA |
89 (79.5) |
Comparator |
Comparator |
| Queensland |
76 (71) |
0.62 (0.31, 1.23) |
0.172 |
| NT |
25 (67.6) |
0.57 (0.23, 1.43) |
0.230 |
| SA |
# |
# |
# |
| Victoria |
# |
# |
# |
| Tasmania |
# |
# |
# |
| ACT |
# |
# |
# |
| Prescriber |
| Specialist |
82 (81.2) |
Comparator |
Comparator |
| GP |
56 (66.7) |
0.47 (0.22, 0.97) |
0.042 |
| Unknown |
* |
* |
* |
| Other |
53 (73.6) |
0.63 (0.28, 1.42) |
0.265 |
| Treatment duration (weeks) |
| 8 |
16 (64) |
1.12 (0.4, 3.16) |
0.828 |
| 12 |
149 (73.8) |
Comparator |
Comparator |
| 16 |
* |
* |
* |
| 24 |
26 (86.7) |
1.48 (0.45, 4.82) |
0.519 |
| Time period |
| March – June 2016 |
50 (83.3) |
Comparator |
Comparator |
| July – December 2016 |
40 (81.6) |
1.21 (0.41, 3.51) |
0.730 |
| January – June 2017 |
29 (80.6) |
1.03 (0.34, 3.17) |
0.953 |
| July – December 2017 |
28 (70) |
0.59 (0.21, 1.66) |
0.315 |
| January – June 2018 |
25 (65.8) |
0.58 (0.2, 1.67) |
0.310 |
| July – December 2018 |
14 (56) |
0.44 (0.14, 1.41) |
0.167 |
| January – June 2019 |
5 (55.6) |
0.39 (0.08, 1.99) |
0.258 |
*Data suppressed where the number of patients was less than six. Totals may not add up due to this inclusion.
#Data not reported because these states or territories do not contain very remote regions.
ACT, Australian Capital Territory; CI, confidence interval; GP, general practitioner; NSW, New South Wales; NT, Northern Territory; OR, odds ratio; SA, South Australia; WA, Western Australia. |
Discussion
This retrospective analysis found that although most patients who started HCV treatment completed their course, the proportion of patients completing treatment in all regions has declined over time between March 2016 and June 2019. Completion varied according to geographic and demographic factors. Residents of outer regional and very remote areas of Australia had the lowest treatment completion rates and, within very remote areas, treatment completion rates were significantly lower for patients treated by GPs. This finding may reflect that patients who are less likely to complete treatment disproportionately receive treatment through GPs. It could also reflect that patients undergoing treatment through a GP may have less advanced liver pathology or lower socioeconomic status, which may be associated with lower treatment completion rates. Further assessment of these patient-specific factors with additional granularity would be beneficial.
GPs play an increasing role in treating HCV and monitoring progress throughout, particularly in more remote areas, given the lack of access to specialists.4 These disparities in access have also been identified in the US,14 but a prospective cohort analysis found that although rural patients have less access to specialists, they were more likely to receive HCV therapies than urban patients.15 A study that compared rural and urban DAA treatment completion in the US found that variation depended on region,16 which similarly reflects our study’s variation in treatment completion by state and territory. Different access to DAA among international healthcare models needs to be taken into consideration, particularly in comparing US and Australian systems.17
Whether access to specialists in remote areas is a driver of treatment completion requires further investigation, because there is no literature on the impact of prescriber type in these areas. It has been shown that the patient–physician relationship significantly affects medication DAA treatment completion among patients in the rural US.18 The implementation of telemedicine may improve access to all prescribers, potentially increasing treatment completion.19 This could be analysed using data from 2020 onwards, during the widespread implementation of telehealth in response to the COVID-19 pandemic.
This study has several limitations. Completion was presumed using PBS dispensing data, but this assumes the patient took the medication for the full course, which could overestimate true completion. Previous DAA treatment completion and adherence studies in the US used a similar method,16,20 as did studies in Australia regarding hepatitis B.11 Alternative evidence-based methods include structured self-reporting, directly observed treatment, electronically monitoring medication containers and pill counts,10 all of which would require a study involving individual participation. These studies, although more accurately measured, are more subject to potential biases in sampling compared with the present study (which includes all individuals treated through Medicare) and are more costly and time-consuming. A systematic review of treatment completion for interferon treatment concluded that the highest completion was reported using self-report strategies and the lowest using pharmacy refill claims.21 The method used here also assumes that the treatment duration indicated by the item number is concordant with the actual recommended treatment duration, which could underestimate completion (eg a patient prescribed the 12-week treatment item despite only requiring an 8-week course). However, this would be expected to result in higher adherence for shorter durations, which was not the case.
Ultimately, a sustained viral response (SVR) at 12 weeks would indicate successful treatment and, indirectly, treatment completion, but this is not available in Medicare data. The Real World Efficacy of Antiviral Therapy in Chronic Hepatitis C (REACH-C) multicentre observational study in Australia found SVR following DAA treatment was high across all patient baseline characteristics such as age, sex, relevant comorbidities and clinic setting.22 A specific definition of required adherence for SVR is yet to be established; however, an international multicentre study defined DAA treatment completion as >90% doses from a blister pack, but also found that SVR was 89% in patients who did not meet this threshold.23 This outcome suggests a degree of forgivability of poor adherence.
A potential limitation to the analysis of PBS data is the possibility of medication supply external to the PBS that is therefore not included in the extracted data. However, given the high cost of DAAs, particularly upon initial PBS subsidisation, it is unlikely that medication for hepatitis C would have been supplied and funded by an external body, such as a state-funded service.8 Furthermore, prior analyses by The Kirby Institute, the main investigator into Australian treatment uptake, similarly assume no notable prescribing outside of the PBS during the time period analysed here.5 Our research included medications dispensed in both community and hospital settings, thereby including all possible supply options through the PBS.
Future analysis of Medicare data, including linkage to other data sources, could investigate other potential drivers, such as the individual DAA medications, Aboriginal and Torres Strait Islander status, location of prescription dispensing and supplying the full medication course at once, as well as assessing SVR testing uptake according to treatment completion. It would be important to investigate the associations of treatment completion at the levels observed here with SVR or liver disease outcomes to assess the impact of these variations in practice.
Conclusion
This analysis of HCV DAA treatment completion using routinely collected data found that very remote areas of Australia had the lowest apparent treatment completion rate and that overall completion decreased over time. Within these very remote areas, patients with GP prescribers are at risk of low treatment completion. These patients could be targeted by interventional studies that aim to improve treatment completion. In addition, across the continuum of HCV care, improved support for patients with reduced access is important to ensure Australia reaches its goals for elimination.