Osteoarthritis is a huge and growing source of morbidity in Australia. Nearly 10% of Australians have osteoarthritis, with this number increasing to 22% in patients aged over 45 years and 36% in patients aged over 75 years.1 Nearly one in 40 general practitioner (GP)–patient encounters involves the management of osteoarthritis.2 One key factor contributing to the onset and progression of osteoarthritis is excess body weight, with obesity leading to a 60% lifetime risk of developing knee osteoarthritis.3–5 With more than two in three Australians being classified as overweight or obese and the higher prevalence of both osteoarthritis and obesity in the ageing population, the burden of knee osteoarthritis will continue to rise.1
Management for osteoarthritis consists of a broad spectrum of interventions, often initiated and monitored by GPs. These interventions include physical therapies (eg exercise and weight loss), pharmacotherapy (eg nonsteroidal anti-inflammatories) and psychological treatments (eg cognitive behavioural therapy).6,7 Ultimately, however, surgical treatment in the form of a total knee arthroplasty might be required.6,7
Numerous studies have assessed weight loss programs and their effects on knee pain and function for overweight or obese patients with knee osteoarthritis. Messier et al demonstrated that weight loss through diet and exercise in combination resulted in improvements in knee pain, although this was not the case with diet or exercise in isolation.8 Miller et al demonstrated that an intensive weight loss program of exercise and diet resulted in improved physical function, with greater improvements for those with greater weight loss.9 The Intensive Diet and Exercise for Arthritis (IDEA) trial helped explain some of these changes, with weight loss in diet groups leading to lower concentrations of pro-inflammatory cytokine interleukin 6, along with reduced joint forces and faster walker speeds.10 Inflammatory biomarkers have been demonstrated to be associated with level of physical function, highlighting their importance.11–13
Several studies have demonstrated that weight loss results in improvements in knee pain, mobility and quality of life.4,14–17 However, there have been inconsistent findings regarding the amount of weight loss needed to achieve a meaningful difference in symptoms, and there has been little to no research on the effect of baseline body mass index (BMI) and baseline knee pain.
The aim of this retrospective, observational study was to evaluate whether baseline BMI or baseline knee pain influences the amount of weight loss required to produce meaningful change for participants in the Osteoarthritis Healthy Weight For Life (OAHWFL) program for overweight (BMI ≥28 kg/m2) patients with knee osteoarthritis.
Methods
OAHWFL program
OAHWFL is a remotely delivered community-based 18-week program that combines weight loss, self-directed exercise and muscle strengthening, and healthcare support. Privately insured patients with a BMI ≥28 kg/m2 and a diagnosis of knee osteoarthritis are eligible to participate in the program. The program is provided at no cost to eligible members of participating health insurance funds, with the cost borne by the insurance fund. The primary enrolment pathway to the program involved identification through hospital claims data, with patients contacted by their health insurer (48%). Secondary enrolment pathways included word-of-mouth (13%) direct referral by a treating orthopaedic surgeon (12%) or primary care medical practitioner (4%). The efficacy of this program in improving knee pain and function has previously been demonstrated.17
Study design, data collection and analysis
This study retrospectively analysed routinely collected data as part of the OAHWFL program, including baseline BMI, weight loss, weight loss as a percentage, and the Knee injury and Osteoarthritis Outcome Score (KOOS) at baseline and on completion. Consecutive, non-selective patients of the OAHWFL program were included in the study. As part of the OAHWFL enrolment process, patients provided consent for their de-identified data to be used for research purposes. Patients who did not complete the program and those without complete data were excluded from the final analysis.
For the purpose of analysis, patients were divided into four groups based on starting BMI: overweight (BMI 28–30 kg/m2), obese class 1 (BMI 30–35 kg/m2), obese class 2 (BMI 35–40 kg/m2) and obese class 3 (BMI ≥40 kg/m2). Differences between groups were assessed for significance using analysis of variance techniques. Age and gender are known covariates associated with an individual’s weight, and as such, these variables were adjusted for by undertaking two-way analysis of covariance. Post hoc testing to identify differences between groups was completed using Tukey’s post hoc testing with Bonferroni corrections. All results were reported as means and standard deviations, along with associated F-statistics, P-values and confidence intervals. Cut-off scores for weight loss ranges and KOOS improvement were determined based on previous research that established reported weight loss ranges and minimal perceptible clinical improvement scores for the KOOS.18 Statistical analysis was completed using the R programming language version 4.0.1 and the Databricks cloud computing platform.
Ethics approval was obtained from the Health and Research Ethics Committee of the Hunter New England Local Health District (approval no. AU202209-01).
Results
A total of 9004 patients were enrolled in the OAHWFL program between 1 January 2014 and 30 July 2022. Of these patients, 1044 did not complete the program, resulting in a dropout rate of 12%. Data cleaning identified 1600 patients without complete KOOS baseline and final scores. These patients were excluded from the analysis. Therefore, a total of 6360 patients were included in the study. Most of the program’s patients were women (71.6%), with a mean age of 63.9 years and a mean BMI of 34.9 kg/m2. The male and female cohorts had a similar mean age and baseline BMI. Mean weight loss in the total cohort was 7.7%, with men losing a mean of 8.13% compared to 7.57% for women. The mean weight loss percentage was consistent across all baseline BMI categories, with a mean of 7.73%, ranging from 7.3% to 7.9%.
Table 1 provides a breakdown of demographics, along with baseline and final KOOS pain and function scores by BMI range. Change scores for pain and function are consistent across all BMI categories for both KOOS pain and function. The differences that are present are not statistically significant, with narrow 95% confidence intervals for the change scores. Average differences for all BMI ranges are above the minimum perceptible clinical improvement of 8–10 points.18
| Table 1. Difference in KOOS pain and function scores by BMI range |
| Baseline BMI category |
Demographics number
Mean BMI
(kg/m2)
Mean weight loss (%) |
KOOS pain |
KOOS function |
| Mean baseline score (SD) |
Mean final score (SD) |
Mean change |
Differences between weight groups
P-value
(95% CI) |
Mean baseline score (SD) |
Mean final score (SD) |
Mean change (SD) |
Differences between weight groups
P-value
(95% CI) |
| All |
6360
35
7.7 |
58 (17) |
72 (18) |
14 (16) |
|
60 (18) |
74 (19) |
14 (16) |
|
| Overweight |
1179
29
7.3 |
61 (16) |
75 (17) |
14 (16) |
P=0.71 (13–14) |
65 (18) |
78 (13) |
13 (15) |
P=0.15 (13–15) |
| Obese class 1 |
2539
32
7.8 |
59 (16) |
72 (18) |
13 (16) |
62 (18) |
75 (19) |
13 (16) |
| Obese class 2 |
1588
37
7.9 |
56 (17) |
70 (18) |
14 (16) |
58 (18) |
72 (19) |
14 (16) |
Obese class 3 |
1054
44
7.8 |
53 (18) |
67 (19) |
14 (16) |
54 (19) |
68 (20) |
14 (17) |
| BMI, body mass index; CI, confidence interval; KOOS, Knee injury and Osteoarthritis Outcome Score; SD, standard deviation. |
Figure 1 provides a representation of improvements in KOOS pain by weight loss amount and BMI range. A statistically significant trend of increasing change scores is seen by percentage weight loss. Additionally, no significant differences are present between BMI ranges at each percentage weight loss range.
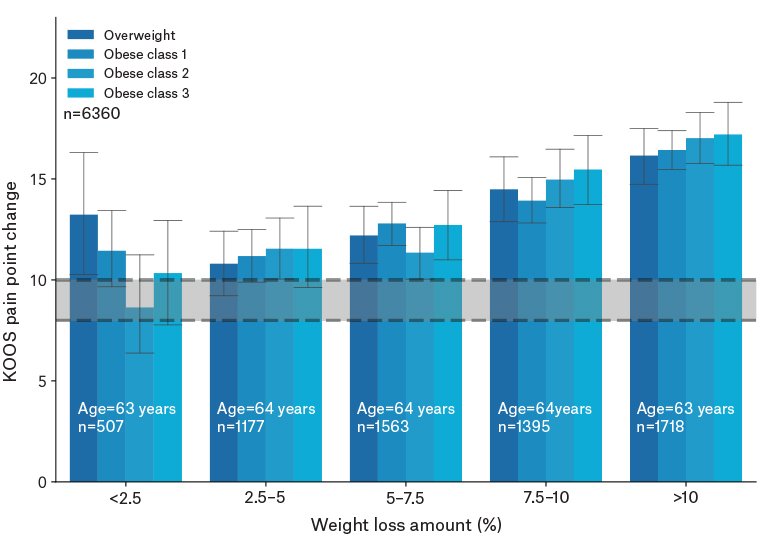
Figure 1. KOOS pain change by weight loss amount for each baseline BMI category. The grey bar represents the minimal perceptible clinical improvement (8–10-point change).18
BMI, body mass index; KOOS, Knee Injury and Osteoarthritis Outcome Score.
Table 2 provides a representation of demographics with KOOS pain and function score changes by baseline KOOS pain scores. All differences by baseline pain category were significantly different from the minimum change of eight points; however, the difference for the mild pain group (KOOS >75) is significantly below the minimum change score. Significant differences are present between groups in KOOS change by baseline pain category for all groups when adjusting for age and gender. That is, the magnitude of the change in KOOS scores as baseline pain levels increase is statistically significant. Figure 2 provides a visual representation of change scores for the KOOS pain and function by baseline KOOS pain ranges. When analysed as two separate groups of those with high baseline pain (KOOS ≤50) and those with low baseline pain (KOOS >50), this difference becomes clearer: those with worse knee pain see nearly double the benefit from the program across every weight loss bracket (Table 2).
| Table 2. KOOS pain and function score changes by baseline KOOS pain score |
| Baseline pain category |
Demographics number
Mean BMI
(kg/m2)
Mean weight loss (%) |
KOOS pain |
KOOS function |
| Mean baseline score (SD) |
Mean final score (SD) |
Mean KOOS pain change (SD) |
P-value (difference between baseline pain groups) |
Mean baseline score (SD) |
Mean final score (SD) |
Mean KOOS function change (SD) |
P-value (difference between baseline pain groups) |
| All |
6360
35
7.7 |
38 (8) |
58 (18) |
20 (18) |
P<0.01 |
66 (11) |
77 (15) |
11 (14) |
P<0.01 |
| Mild (75–100) |
1131
34
7.6 |
82 (7) |
86 (10) |
4 (10) |
P<0.01 |
82 (11) |
88 (12) |
6 (11) |
P<0.01 |
| Moderate (50–74.9) |
3293
35
7.7 |
61 (7) |
74 (14) |
13 (13) |
63 (12) |
77 (16) |
14 (14) |
| Severe (25–49.9) |
1793
36
7.8 |
40 (6) |
60 (18) |
20 (17) |
44 (12) |
62 (20) |
18 (18) |
| Extreme (<25) |
143
38
7.8 |
17 (5) |
44 (22) |
27 (22) |
23 (12) |
46 (24) |
23 (22) |
| BMI, body mass index; KOOS, Knee Injury and Osteoarthritis Outcome Score; SD, standard deviation. |
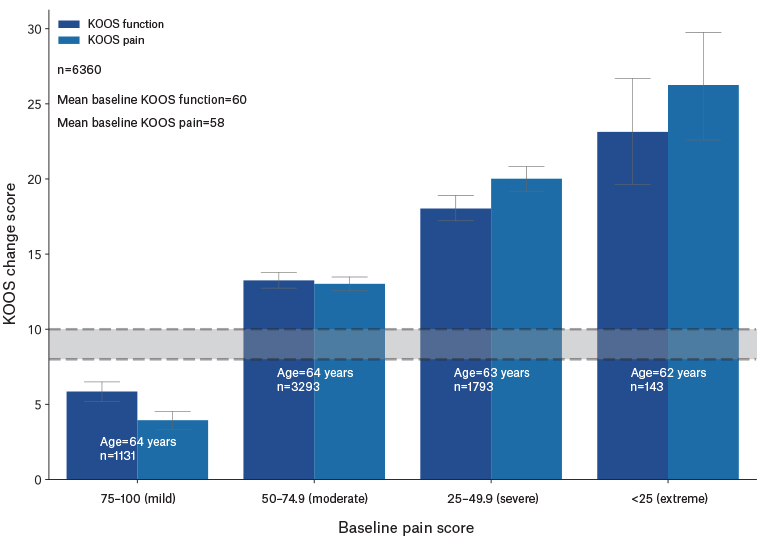
Figure 2. KOOS change by baseline pain score. The grey bar represents the minimal perceptible clinical improvement (8–10-point change).18
KOOS, Knee Injury and Osteoarthritis Outcome Score.
Discussion
This study uses the largest cohort in the literature to date to assess the effect of weight loss in overweight and obese patients with knee osteoarthritis. It provides strong evidence that weight loss has a positive effect on knee pain and function, and this can be achieved in a relatively short time frame. This study demonstrated a dose–response relationship between weight loss and improvement in knee symptoms, aligning with previous results.14,19 It demonstrates that diet, exercise and psychosocial support programs have a significant role to play in the management of an increasingly common and burdensome health condition.
This study demonstrated that it is the weight loss percentage achieved that determined the magnitude of improvement seen, rather than baseline BMI. We found that the percentage weight change achieved was similar between baseline BMI groups, with weight loss ranging from 7.3% to 7.9%; this result was similar to those of other studies.12,16 In addition, this study has revealed that patients might see a clinically relevant improvement in pain with as little as 2.5% weight loss in all baseline BMI categories. This finding demonstrates that weight loss can improve patients’ knee pain and function, irrespective of baseline weight.
The analysis evaluating the effect of baseline knee pain on outcomes demonstrated that patients with worse symptoms achieved greater improvement. It should be noted that only patients with a baseline KOOS score of less than 75 achieved a meaningful improvement. When comparing patients with baseline KOOS pain broken down into high and low, we found that patients with the worse knee pain experienced nearly double the benefit from the program across every weight loss bracket (Table 2). This finding is clinically relevant as patients with the most debilitating pain have the most to gain from participation in a program such as OAHWFL.
A recent randomised control trial published by Messier et al in The Journal of the American Medical Association (JAMA) demonstrated that patients completing a community-based diet and exercise program lost significantly more weight, had a smaller waist circumference, demonstrated significant improvements in the Western Ontario and McMaster Universities Arthritis Index (WOMAC) function score and performed better on the six-minute walk test.20 However, they found that at 18 months after the program, the improvement in pain scores remained similar to that of the control group. Several points distinguish this population from our own, including that most patients participating in the trial have ‘mild’ baseline pain (defined as WOMAC <8). As discussed above, patients with less severe symptoms benefit less from such interventions, and this might partially explain their findings. Their patients also had mixed levels of adherence to the interventions prescribed, something that might reflect the difficulty in maintaining these kinds of lifestyle modifications in this patient population over long follow-up periods and might reflect bias in our data by not including patients who did not complete the intervention. We believe that despite the findings of their study, we have enough robust data to support the efficacy of such an intervention, although longer-term follow-up is required.
The main strength of this study is the large sample size, with this study currently representing the largest analysis in its field to date. This increases the generalisability of the results, although only including privately insured patients in the study might limit the applicability of the results to other populations, with potential differences in socioeconomic status or health literacy.
This study does have limitations. The short-term follow-up period, with data only available up to 18 weeks, means we are unable to ascertain whether the results are sustainable. In addition to weight loss, the program included strength, balance and mobility exercises, and it is possible that these exercises contributed to the improvement observed. The exercise and psychosocial support aspects of this program might also account for some of the symptom improvement. However, research from the field of bariatric surgery, where patients are not provided any supplementary interventions, supports our use of weight loss as the measure of success leading to symptomatic improvements. Weight loss is hypothesised to reduce inflammation and have positive structural effects on cartilage.12,21 The use of KOOS as a measure means the results are based on patient self-reported outcome measures, which are subjective. As only patients who completed the program were included in the study, there is the potential for biased results.
Future studies in this field should include longer-term follow-up to ascertain whether the results are sustainable. One question of interest is progression to arthroplasty, although these therapies are often not mutually exclusive and, instead, might be complementary.
Conclusion
This study demonstrates that weight loss achieved through the OAHWFL program results in a meaningful change in knee osteoarthritis symptoms. We found that the greater the weight loss achieved, the greater the improvement seen, with baseline weight having no effect on the magnitude of the outcome. This study highlights the benefit of weight loss, diet and exercise for those with severe pain, as these patients saw greater improvement in their symptoms than those with more mild symptoms. These are important, clinically relevant messages that can be relayed to patients suffering from this ubiquitous disease.