Numbness, tingling, aching, shooting and burning pain in the feet are hallmark symptoms of diabetic peripheral neuropathy (DPN), which affects approximately one in three people with type 2 diabetes.1 DPN symptoms might present alone or in combination with other musculoskeletal disorders, although this clustering of comorbidities is poorly understood.2,3 Foot symptoms negatively impact daily activities, including walking, balance and sleep,2,4 and directly or indirectly interfere with or decrease physical activity levels.5,6 Because people with diabetes have a higher mean number of doctor visits for limb pain,7 medical practitioners should pay special attention to foot symptoms when treating these individuals.
Although numbness might be omnipresent, other DPN sensations might be short lived, occurring spontaneously or be evoked in response to movement or other stimuli, such as when the feet touch the floor.8 These symptoms might not be accurately captured by classic self-report questionnaires, where participants retrospectively recall the intensity and/or frequency of symptoms experienced. Ecological momentary assessment (EMA), where symptoms are recorded in a participant’s natural environment at multiple points in time,9 might reduce recall bias and more accurately measure symptoms, helping us to better understand how DPN symptoms vary throughout the day or in response to stimuli, such as physical activity.
Different patterns of sensory symptoms exhibited in the feet by patients with DPN might indicate different neurobiological mechanisms,10–12 and potentially different responses to treatment.11,13 Although symptoms in patients with DPN are believed to originate in the peripheral nervous system, it is now widely accepted that altered endogenous pain modulation, which refers to the ability of the central nervous system to augment or reduce pain, might also contribute to painful DPN.14–16 Temporal summation of pain (TSP) and conditioned pain modulation (CPM) protocols are used to study endogenous pain facilitation and inhibition, respectively, and might help explain the different symptom experiences of patients with DPN.
This study aimed to: (1) compare foot symptoms between days, time points and periods with/without preceding physical activity or pain medication; and (2) determine relationships between foot symptoms and endogenous pain modulation (TSP and CPM).
Methods
This prospective observational study comprised a laboratory session to evaluate endogenous pain modulation and a seven-day period of EMA using repeated mobile phone surveys combined with physical activity monitoring using accelerometry.
Participants gave written informed consent prior to the laboratory session.
Participants
A convenience sample of participants located in Brisbane, Australia, were recruited for the purposes of a separate clinical trial involving exercise and eHealth between September 2019 and January 2020 using university and local diabetes agency newsletters and social media. To be eligible for inclusion, participants had to be community-dwelling adults aged 30–80 years; have a diagnosis of type 2 diabetes made by their doctor; not be meeting exercise recommendations for adults with diabetes (ie at least 210 minutes per week of moderate-intensity exercise or 125 minutes per week of vigorous intensity exercise or their combination);17 and have definite or probable diabetic neuropathy determined by any of the following criteria: absence of Achilles tendon reflex, absence of 5.07 (10-g) monofilament sensation (Aesthesio; DanMic Global) or vibration perception lower than four using a 64-Hz tuning fork (Rydel-Sciffer tuning fork; US Neurologicals) over the plantar aspect of one or both third metatarsals or abnormality of any attribute of nerve conduction in two separate nerves, one of which had to be the sural nerve.18 Exclusion criteria were a current leg ulcer or comorbid condition preventing exercise, as outlined elsewhere.19 The presence of other musculoskeletal conditions was not an exclusion criterion.
Temporal summation of pain
TSP refers to the perception of increasing pain in response to repeated noxious stimuli and is linked to activation of N-methyl-d-aspartate (NMDA) receptors in the dorsal horn.20 TSP was assessed over the plantar aspect of the third metatarsal of each foot using a 256-mN weighted pinprick stimulator (MRC Systems). Participants provided a pain rating in response to a single pinprick stimulus and a series of 10 identical stimuli at a rate of 1 Hz within a 1-cm2 area using a numerical rating scale (NRS), ranging from no pain (0) to worst imaginable pain (10). Five series were performed, alternating between sides. TSP was calculated by subtracting average pain ratings of the single pinprick from the pinprick series.13,21 The average between legs was used in analysis.
Conditioned pain modulation
CPM refers to the phenomenon known as ‘pain inhibits pain’, which occurs when the response to a painful (test) stimulus is inhibited by another, distant, noxious (conditioning) stimulus.22 CPM is a lower brainstem-mediated inhibitory mechanism that has been linked to several pain syndromes.23 CPM was performed in a seated position. The conditioning stimulus involved immersion of the left hand in cold water maintained at 7°C for 60 seconds (Polyscience). For the test stimulus, pressure pain thresholds (PPT) were measured over the dorsal aspect of the first metatarsophalangeal joint of the right foot using a hand-held algometer (Type II; Somedic AB) with a 1-cm2 area and rate of 30 kPa/s. Three PPT measurements were performed prior to cold water immersion and one trial during the last 30 seconds of immersion. CPM was calculated by subtracting the average PPT before immersion from PPT during immersion.22 The intensity of hand pain during immersion (test stimulus) was also reported on the same NRS 0–10 scale as above.
Ecological momentary assessment
A freely available app (https://pielsurvey.org) was used to administer a customised survey five times per day for seven days. Using EMA methodology and a time-based sampling approach, participants received a phone notification every three hours between 8.00 am and 8.00 pm. Participants had 30 minutes to complete each survey before it expired, with each survey taking approximately three minutes to complete. After Day 7, participants received a notification that enabled automated email of survey data to the investigators.
Survey questions were adapted from the Neuropathy Total Symptom Score (NTSS-6) questionnaire24 by asking participants to rate the intensity of each of the following symptoms ‘right now’ on a slider visual analogue scale (VAS) with endpoints ‘none at all’ to ‘severe’ (deep aching, sensitivity to touch, burning pain, shooting pain, numbness and prickling/tingling). Participants were informed they should focus on symptoms of DPN. VAS scores were automatically coded from 0 to 1, with 0 representing absence of the symptom. In addition, participants reported (yes/no) whether they had performed physical activity of at least a moderate intensity (eg a brisk walk) or consumed pain medication in the three hours before the survey.
Accelerometer-derived physical activity
Accelerometry was used to determine agreement between objective and self-reported physical activity. Participants wore a physical activity monitor (GT3X+; ActiGraph) on their non-dominant wrist, 24 hours per day for seven days. Raw acceleration was measured in three axes at 30-Hz time resolution. Data were processed in R statistical software using open-source code,25 computing mean wear time over 24 hours and unbouted physical activity, expressed as acceleration in milligravity units. Time performing moderate to vigorous physical activity (MVPA; acceleration higher than 100 milligravity units)26 was extracted for three-hour periods from 5.00 am to 5.00 pm.
Statistical analysis
EMA data were exported into a Microsoft Excel spreadsheet and matched with timestamped accelerometry data. Analysis was performed using Stata 17.0 (StataCorp). Survey completion rates and the percentage of surveys in which participants self-reported physical activity/pain medication were calculated for the seven-day period and for each time of day. To determine agreement, accelerometry-derived MVPA was compared between periods with and without self-reported physical activity using the Wilcoxon rank-sum test. To evaluate whether the intensity of symptoms varied between days, time points and periods with/without physical activity or pain medication in the previous three hours, a multivariate analysis of variance (MANOVA) model was created, including all six foot symptoms as dependent variables and the following independent variables: days (seven levels), time points (five levels from 8.00 am to 8.00 pm), prior physical activity (yes/no) and prior pain medication (yes/no). Where significant effects (Wilks’ lambda P<0.05) were observed, analysis of variance (ANOVA) was performed for each symptom. The relationships between endogenous pain modulation (TSP and CPM) and foot symptoms (median VAS scores over the seven-day period) were explored using Spearman correlation coefficients. Rho values were interpreted as small (<0.30), moderate (0.30–0.49), large (0.50–0.69), very large (0.70–0.89) or near perfect (0.90–1.00).27
Data are presented as the mean and standard deviation (SD) or as the median with interquartile range (IQR), as appropriate.
Ethics approval was received from Griffith University (2019/214) and The University of Queensland (2019001070).
Results
Fifty-six people responded to the advertisement. Forty-six participants were excluded for reasons including not type 2 diabetes or probable DPN (n=7), significant medical comorbidity (n=8), current leg ulcer (n=5) or meeting exercise recommendations (n=8), declined to participate (n=16) or medical clearance not obtained (n=2). Ten participants (five female, five male; mean age 61.7±6.3 years, mean duration of diabetes 11.5±9.1 years and median HbA1c 6.8% [IQR 6.4–7.7%]) were included.
Participants completed 311 out of 350 surveys, representing an average completion rate of 89%. The distribution of completion rates during the day was 87%, 91%, 84%, 91% and 90% at 8:00 am, 11:00 am, 2:00 pm, 5:00 pm and 8:00 pm, respectively. Pain medication was reported being consumed in the preceding three hours on 8% of surveyed periods (8%, 3%, 12%, 13%, 5% at 8:00 am, 11:00 am, 2:00 pm, 5:00 pm and 8:00 pm, respectively). Participants self-reported performing physical activity of at least moderate intensity during the preceding three hours on 21% of surveyed periods (18%, 25%, 24%, 31% and 8% at 8:00 am, 11:00 am, 2:00 pm, 5:00 pm and 8:00 pm, respectively).
Accelerometer data could not be downloaded for one participant, whereas the mean wear time was 23.6±1.9 h/day for other participants. Participants performed a median MVPA of 19.5 minutes (IQR 11–27 minutes) during periods with self-reported physical activity, compared with 5.5 minutes (IQR 2–11 minutes) for periods where no physical activity was reported (P<0.001).
Effects of days, time points, physical activity and pain medication on foot symptoms
Using a MANOVA model including all foot symptoms, a significant effect of self-reported physical activity (P<0.001) and pain medication (P<0.001) was observed. There were no significant differences between days (P=0.45) or time points (P=0.34). For periods that participants reported physical activity in the preceding three hours, greater intensity of all foot symptoms except numbness was reported (Figure 1). Only greater intensity of shooting pain (P<0.001) was reported for periods that participants reported pain medication in the preceding three hours (Figure 2).
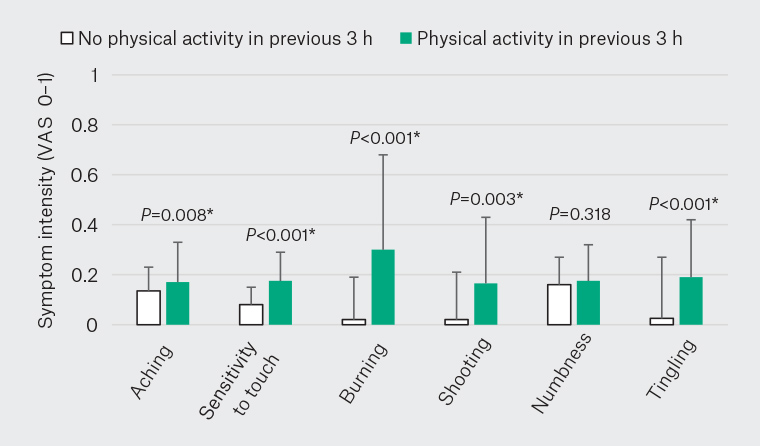
Figure 1. Momentary intensity of foot symptoms for periods where participants self‑reported whether they performed or did not perform physical activity in the previous 3 h. Columns and error bars represent the median and 75th percentile, with significance indicated by asterisks (P<0.05).
VAS, visual analogue scale.
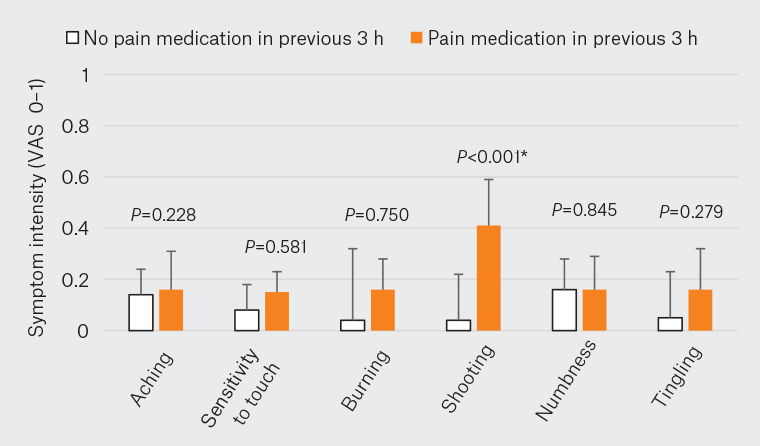
Figure 2. Intensity of foot symptoms for periods where participants self-reported whether they consumed or did not consume pain medication in the previous three hours. Columns and error bars represent median and 75th percentile, with significance indicated by an asterisk (P<0.05).
VAS, visual analogue scale.
Relationships between endogenous pain modulation and foot symptoms
Spearman correlation coefficients (Table 1) were very large for relationships between TSP and sensitivity to touch, burning pain, shooting pain and prickling/tingling. There were no significant relationships with numbness or deep aching. Very large correlations were found between the CPM test stimulus (hand pain during cold water immersion) and sensitivity to touch, burning pain and prickling/tingling. However, no significant relationships were found between CPM and any symptoms.
| Table 1. Correlations between endogenous pain modulation and the median intensity of foot symptoms over the seven-day period |
| |
TSP |
CPM |
CPM test stimulus |
| Deep aching |
ρ=0.35, P=0.32 |
ρ=–0.28, P=0.51 |
ρ=0.17, P=0.67 |
| Sensitivity to touch |
ρ=0.88, P=0.007 |
ρ=0.05, P=0.91 |
ρ=0.74, P=0.02 |
| Burning pain |
ρ=0.81, P=0.005 |
ρ=0.29, P=0.48 |
ρ=0.91, P=0.007 |
| Shooting pain |
ρ=0.97, P<0.001 |
ρ=–0.14, P=0.74 |
ρ=0.66, P=0.05 |
| Numbness |
ρ=0.49, P=0.15 |
ρ=0.29, P=0.48 |
ρ=0.34, P=0.37 |
| Prickling/tingling |
ρ=0.78, P=0.008 |
ρ=0.31, P=0.44 |
ρ=0.78, P=0.01 |
| CPM, conditioned pain modulation; TSP, temporal summation of pain. |
Discussion
Physical activity is critical to self-management of type 2 diabetes; however, symptoms of DPN are commonly cited by patients as a barrier to engaging in moderate to vigorous physical activities.2,28 To the best of our knowledge, this is the first study to provide evidence that the intensity of foot symptoms (except numbness) is indeed greater in periods after physical activity of at least moderate intensity. These findings highlight that for people with DPN and comorbid musculoskeletal conditions, physical activity is like a double-edged sword. Practitioners should be empathetic of these lived experiences when encouraging people with DPN to exercise and be active. Subsequent strategies might include discussing physical activity outcome expectations and pain coping skills.
These findings should not be confused with other research showing promising improvements in symptoms of DPN following a course of supervised exercise. Several small-scale, uncontrolled or non-randomised studies have identified improvements in pain or neuropathic symptoms29,30 or pain interference31 following aerobic,31 resistance30 or combined exercise29 in people with DPN.29,31,32 However, pain might interfere not only with a person’s willingness to participate in an exercise program, but also with pain modulation during exercise.14 High levels of muscle pain and impaired exercise-induced hypoalgesia were identified in people with painful DPN compared with participants with type 2 diabetes but without DPN.14 In the present study, TSP but not CPM was highly correlated with the median intensity of several foot symptoms experienced over a seven-day period, suggesting that the mechanisms might involve facilitation of pain within the dorsal horn, rather than impaired descending pain inhibition (CPM). Recent research showed CPM was not impaired (actually more efficient) in people with painful DPN, although altered sensory input from the periphery was proposed as a potential reason.33 The presence of comorbid musculoskeletal conditions might also contribute to exacerbation of DPN symptoms with exertion as increased peripheral sensory input from muscles, joint and ligaments in the feet might be amplified in the dorsal horn in individuals with TSP.
The strengths of this study include the use of repeated surveys, a high survey response rate and agreement between self-reported and objective (accelerometry) measures of physical activity. Limitations include the small sample size and that missing data were not imputed. The present study sought to recruit DPN participants representative of patients seen in general practice; hence, the sample included participants with painful and non-painful DPN and other musculoskeletal problems. Limitations regarding criteria for diagnosis of probable DPN, including exclusion of other causes of peripheral neuropathy, are acknowledged. Furthermore, we recruited participants not meeting exercise recommendations using current Australian guidelines for people with diabetes, which differs from other international guidelines. It is possible that participants with varied physical activity levels might show different symptom experiences. Finally, participants were asked whether they took pain-relieving medication in the last three hours and greater shooting pain was associated with preceding medication consumption. Although pain presumably preceded the need to take analgesia, causality cannot be concluded.
Conclusion
This study provides proof-of-concept that EMA is a feasible, innovative method for studying a range of fluctuating symptoms over a seven-day period in people with DPN. Using this approach, participants with DPN reported that positive but not negative foot symptoms were more intense following physical activity. Compared with classic patient-reported outcome measures, EMA might be more sensitive to detecting treatment effects or lead to advances in clinical care by identifying more individualised approaches to exercise rehabilitation in people with DPN.