Patients experiencing homelessness, deprivation and marginalisation are often affected by physical and mental illness, as well as by misuse of alcohol and drugs.1 The combination of early onset multiple chronic diseases2 and poor access to primary healthcare leads to higher prevalence of multimorbidity and associated disease severity, compared with mainstream populations,3 and is accompanied by higher direct and indirect health costs.4 A recent US paper was critical of attempts at cost savings for services to this population, arguing instead that it is preferable to focus on meeting the real-life needs of the marginalised and homeless rather than reducing ‘a complex social situation to a financial calculation’.5
Being labelled ‘homeless’ creates stigma and discrimination.6 Such patients avoid contact with regular doctors, engaging reactively instead with healthcare services.7 A Swedish study found homeless men and women had twice the risk of being hospitalised for physical diseases, compared with housed counterparts, with those aged 18–35 years at highest risk.8 National data show annual inpatient costs for homeless individuals in England are eight times that of the housed population, with attendances at emergency departments (EDs) five times higher.9
The Freo Street Doctor (FSD) service is a free, primary care–based, mobile clinic that has been operating in Fremantle, Western Australia since 2005. It operates from locations within the city and surrounding suburbs, offering homeless and disadvantaged patients access to an accredited general practice service.10 The FSD is serviced by a number of general practitioners (GPs) but also works collaboratively with several ancillary services to improve the health and circumstances of patients in this population group. Service access is unrestricted, and electronic records are maintained for all attendees.
This study used the Cumulative Illness Rating Scale (CIRS)11–13 to determine multimorbidity, focusing on cumulative and synergistic effects of conditions categorised by anatomical domains rather than simply counting numbers of conditions, thereby ensuring more rigorous assessment of multimorbidity.
We previously published on multimorbidity in the FSD patient cohort of 2006–11.3 This study extends data coverage over the decade 2006–15 and complements our qualitative study exploring patient reasons for attending the service.14
Methods
Study design
A retrospective cohort study was undertaken incorporating electronic medical record review. The entire patient cohort attending the FSD service in 2006–15 was examined. Data extraction and coding of patient records were undertaken in two stages: 1 January 2006 – 31 December 2011 (n = 2587), completed in July 2012; and January 2012 – 31 December 2015 (n = 1698), completed in December 2016. The GP software used was consistent over both cohorts. For the 2012–15 sample, we excluded persons with prior visit(s) in 2006–11. Thus, each cohort comprised discrete persons with first visits to the service in each respective time period.
Data extraction and scoring
Electronic medical records of patients were reviewed and rated using the validated CIRS method.11–13 Each rater was assigned a subset of patients to score. All raters had health-related backgrounds and trained in the application of the CIRS. Inter-rater reliability was empirically assessed (outlined below).
For the 2006–11 cohort, 42 conditions, and for the 2012–2015 cohort, 43 conditions (skin conditions identified separately) were scored using CIRS criteria (0 = no problems, 1 = mild problems, 2 = moderate morbidity, 3 = severe morbidity, 4 = extremely severe functional impairment). Conditions were categorised into 14 body system domains affected (Appendix 1, available online only) and maximum scores summed for each domain to generate a total score (0–56) for each patient. The total score was divided by number of domains with identified morbidities to generate a CIRS Severity Index (SI) score for each patient (0 = none/low, 1 = mild, 2 = moderate, 3 or 4 = severe). The frequency of at least one severe or extremely severe condition (ie level 3 or 4 score) within CIRS domains was also included as an additional indicator of disease severity.
12
We defined multimorbidity as chronic (>6 months) and deteriorating conditions affecting ≥2 domains.15
Inter-rater reliability
To assess inter-rater reliability, raters scored a common set of 30 (2006–11 cohort) and 50 (2012–15 cohort) randomly selected patients. Inter-rater reliability was assessed using the intra-class correlation coefficient (ICC) on CIRS scores and number of domains with morbidities. To assess inter-rater reliability between cohorts, we calculated the ICC on CIRS scores between two raters common to both cohorts based on 60 randomly selected patients (30 from each cohort).
Previously reported ICC for the 2006–11 cohort was 0.94 (95% CI: 0.89–0.97) for number of domains with morbidities, and 0.96 (95% CI: 0.93–0.98) for CIRS scores.3 For the 2012–15 cohort, the ICC was 0.92 (95% CI: 0.86–0.96) for number of domains with morbidities, and 0.62 (95% CI: 0.37–0.79) for CIRS scores. The ICC between cohorts was 0.94 (95% CI: 0.90–0.96) for CIRS scores.
Statistical analysis
Data analysis was conducted using Stata 14.0. All analyses were tested against an alpha level of 0.05 (two-tailed). Demographic data are expressed as means ± standard deviation for continuous variables and frequencies (percentages) for categorical variables. Crude differences between FSD patients in the 2006–11 and 2012–15 cohorts were examined using independent sample t-tests and chi-square tests for continuous and categorical variables, respectively.
Severity was examined using the CIRS SI score and as distribution between age categories. General linear modelling (GLM) was used to examine differences in severity between Aboriginal and non-Aboriginal patients, controlling for age and sex. The relationship between demographic characteristics (age, sex, Aboriginal status) and the presence (Y/N) of multimorbidity across two, three and five domains was examined using a series of multivariate logistic regression analyses.
Ethics
Ethical approval was granted by the University of Notre Dame Human Research Ethics Committee (Project ID 015154F).
Results
A total of 4285 patients attended the FSD service over the study period (2006–15). Data for the 2006–11 cohort reported previously3 is included for reference and temporal comparison.
Patient characteristics
Table 1 shows patient characteristics. The majority of FSD patients were male. The proportion of Aboriginal patients attending (mainly female) increased between the two cohorts. Though less than the proportion of males, that of non-Aboriginal females increased over time.
| Table 1. Age and gender distribution |
| |
Overall |
2006–11 cohort3 |
2012–15 cohort |
| |
Total |
Aboriginal |
Non-Aboriginal |
Total |
Aboriginal |
Non-Aboriginal |
Total |
Aboriginal |
Non-Aboriginal |
| Number of patients |
4,285 |
1,332 (31.5) |
2,897 (68.5) |
2,587 |
766 (29.6) |
1,821 (70.4) |
1,698 |
566 (34.5)^ |
1,076 (65.5) |
| Sex, n (%) |
| Male |
2,496 (58.3) |
656 (49.2)* |
1,809 (62.4) |
1,482 (57.3) |
385 (50.3) |
1,097 (60.2) |
1,014 (59.7) |
271 (47.9) |
712 (66.2) |
| Female |
1,789 (41.2) |
676 (50.8)* |
1,088 (37.6) |
1,105 (42.7) |
381 (49.7) |
724 (39.8) |
684 (40.3) |
295 (52.1)† |
364 (33.8)† |
| Age, mean ± SD [range] years |
| Overall |
38.2 ± 17.9
[<1–103.0]
|
32.1 ± 18.1*
[<1–82.7] |
41.1 ± 17.2
[<1–103.0] |
37.8 ± 18.7
[<1–103.0] |
32.1 ± 17.9
[<1–81.0] |
40.2 ± 18.4
[<1–103.0] |
38.8 ± 16.8
[1.4–89.0] |
32.2 ± 18.2
[1.4–82.9] |
42.5 ± 14.8†
[2.7–89.0] |
| Male |
39.6 ± 17.7
[<1–103.0]
|
31.5 ± 18.4*
[1–81.0] |
42.5 ± 16.6
[<1–103.0] |
39.1 ± 16.5
[<1–103.0] |
31.8 ± 18.1
[1–81.0] |
41.6 ± 17.9
[<1–103.0] |
40.3 ± 16.5
[1.4–88.5] |
31.1 ± 18.8
[1.4–77.9] |
43.9 ± 14.1†
[3.9–88.5] |
| Female |
36.2 ± 18.1
[<1–90.0] |
32.7 ± 17.7*
[<1–82.9] |
38.6 ± 17.9
[<1–90.0] |
36.1 ± 18.7
[<1–90.0] |
32.3 ± 17.7
[<1–75.0] |
38.0 ± 18.9
[<1–90.0] |
36.6 ± 16.9
[1.9–89.0] |
33.2 ± 17.6
[1.9–82.7] |
39.7 ± 15.8
[2.7–89.0] |
| Age category, years, n (%) |
| <25 |
970 (22.6) |
491 (36.9)* |
465 (16.1) |
626 (24.2) |
282 (36.8) |
344 (18.9) |
344 (20.3) |
209 (36.9) |
121 (11.3)† |
| 25– 44 |
1,739 (40.6) |
482 (36.2)* |
1,229 (42.4) |
1,023 (39.5) |
274 (35.8) |
749 (41.1) |
716 (42.2) |
208 (36.8) |
480 (44.7) |
| 45–64 |
1,288 (30.1) |
321 (24.1)* |
956 (33.0) |
732 (28.3) |
187 (24.4) |
545 (29.9) |
556 (32.8) |
134 (23.7) |
411 (38.2) |
| 65–74 |
194 (4.5) |
29 (2.2)* |
162 (5.6) |
136 (5.3) |
18 (2.4) |
118 (6.5) |
58 (3.4) |
11 (1.9) |
44 (4.1) |
| ≥75 |
93 (2.2) |
9 (0.7)* |
84 (2.9) |
70 (2.7) |
5 (0.7) |
65 (3.6) |
23 (1.4) |
4 (0.7) |
19 (1.8) |
Aboriginal status was not recorded for 56 patients of the 2012–15 cohort (1.3% of the total cohort)
*P <0.05, compared with non-Aboriginal; †P <0.05, compared with 2006–11 cohort3
SD, standard deviation |
Multimorbidity prevalence
Multimorbidity was present in 53.0% (2269/4285) of patients overall. This is an increase from 46.4% (1199/2587) in 2006–11 to 63.0% (1070/1698) in 2012−15, (P <0.001). Overall, significantly more Aboriginal patients (58.0%, 774/1332) had multimorbidity, compared with non-Aboriginal patients (50.6%, 1466/2897; P <0.001).
Figure 1 shows the age distribution of multimorbidity. The difference between the two cohorts in the prevalence of multimorbidity is greatest in Aboriginal and non-Aboriginal patients aged <25 years.
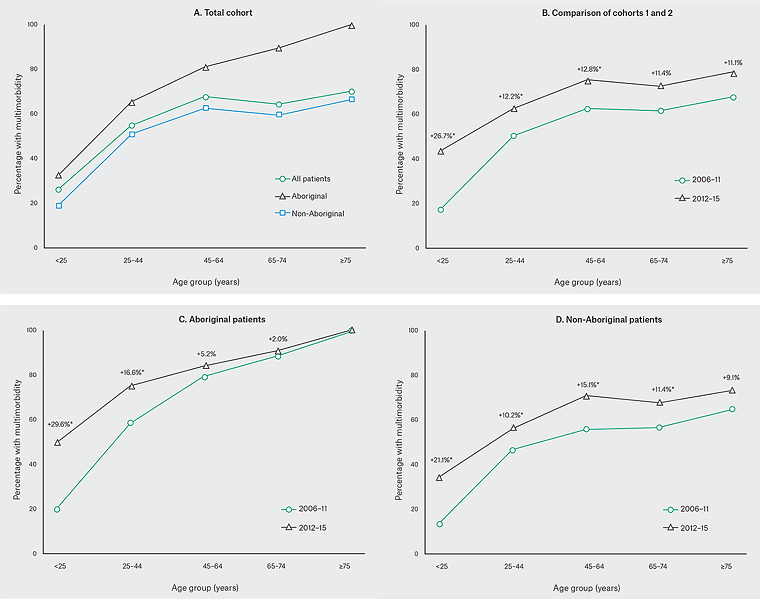
Figure 1. Prevalence of multimorbidity (≥2 domains): 2006–11 cohort3
*P ≥0.05 cohorts 2006–11 versus 2012–15
Multimorbidity patterns
Domain combinations for the 2006–11 cohort have been reported previously.3 For the 2012–15 cohort, the most commonly affected domains individually or across combinations were psychiatric, musculoskeletal (including integumental) and respiratory (Appendix 2, available online only). For this cohort, Aboriginal patients had a significantly higher frequency of chronic skin conditions (46.1%, 261/566), compared with non-Aboriginal patients (29.7%, 320/1076; P <0.001).
Severity index
The majority of patients’ conditions were of mild or moderate severity (Table 2). Only 19% of patients had no or low-severity chronic conditions. The proportion of patients with at least one severe or extremely severe condition (scored at level 3 or 4) across all domains increased with multimorbidity and was higher for Aboriginal patients. This disparity was present across all age groups ≥25 years and greatest for those aged ≥65 years. The SI (Figure 2) increased in patients attending in 2012–15 compared with 2006–11.
| Table 2. Severity scores for total cohort |
|
|
| |
Overall, n = 4,285* |
Aboriginal, n = 1,332 |
Non-Aboriginal,
n = 2,897
|
| Severity index score, mean ± SD [range] |
1.37 ± 0.84 [0 4.0] |
1.40 ± 0.80† [0–4.0] |
1.36 ± 0.89 [0–4.0] |
| Severity index category, n (%) |
|
|
|
| None/low |
815 (19.0) |
214 (16.1)† |
595 (20.5) |
| Mild |
1,759 (41.1) |
568 (42.7)† |
1,157 (39.9) |
| Moderate |
1,511 (35.3) |
501 (37.6)† |
996 (34.4) |
| Severe |
199 (4.7) |
48 (3.6) |
149 (5.1) |
| All patients with severe or extremely severe condition within domains |
| Number of patients, n (%) |
1,148 (26.8) |
406 (30.5)† |
732 (25.3) |
| Age category (years) breakdown, n (%) |
|
|
|
| <25 |
58 (5.9) |
29 (5.9) |
29 (6.2) |
| 25–44 |
518 (29.8) |
180 (37.3)† |
331 (26.9) |
| 45–64 |
504 (39.1) |
176 (54.8)† |
325 (34.0) |
| 65–74 |
48 (24.7) |
15 (51.7)† |
33 (20.4) |
| ≥75 |
20 (21.5) |
6 (66.7)† |
14 (16.7) |
| Patients with multimorbidity (2+ domains) and severe or extremely severe condition within domains |
| Number of patients, n (%)‡ |
1,001 (44.1) |
372 (48.1)† |
621 (42.4) |
| Age category (years) breakdown, n (%) |
| <25 |
40 (15.8) |
25 (15.5) |
15 (16.9) |
| 25–44 |
439 (45.9) |
158 (50.0)† |
276 (44.2) |
| 45–64 |
459 (52.8) |
168 (64.4)† |
288 (48.1) |
| 65–74 |
45 (36.0) |
15 (57.7)† |
30 (30.9) |
| ≥75 |
18 (27.7) |
6 (66.7)† |
12 (21.4) |
*Aboriginal status not recorded for 56 patients
†P<0.05, compared with non-Aboriginal patients
‡Percentage of 2,269 patients with 2+ domain |
Risk factors for multimorbidity
For the total cohort, multimorbidity was significantly associated with male sex (OR 1.4; 95% CI: 1.2–1.6; P <0.001), increasing age (OR 1.1; 95% CI: 1.04–10.5; P <0.001) and Aboriginality (OR 2.1; 95% CI: 1.8–2.4; P <0.001).
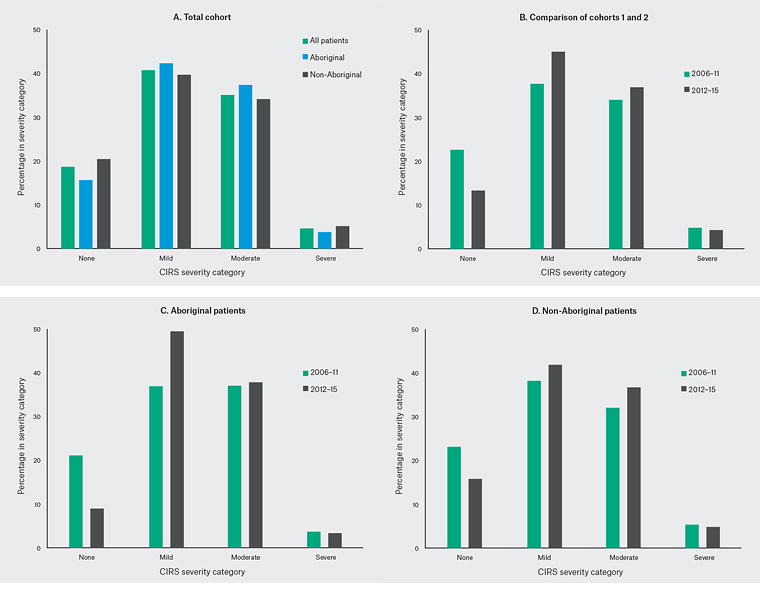

Figure 2. Breakdown of severity for the total cohort over time
Discussion
Much of the research to date on chronic disease in homeless and marginalised populations has focused on patients inappropriately attending EDs.16 We examined medical records from a GP-accredited, street-based clinic involving a large cohort of homeless and marginalised patients (n = 4285) over a 10-year period.
Findings from this study are in line with our previous research3 and other studies17,18 showing high prevalence of multimorbidity in marginalised patients, ranging from 46.3% to 69.9% across various studies. The overall trend shows prevalence increasing between the two data periods. The reasons for this are unclear but this trend has been observed internationally,8 suggesting the observation is not an aberration resulting from differences in inter-cohort ratings or selection bias between samples in our study.
Psychiatric, musculoskeletal and respiratory conditions were the most frequent presentations. We have accounted for the limitation noted in our previous analysis3 and separated chronic skin problems from other musculoskeletal or integumental conditions. In doing so, we have highlighted chronic skin conditions as prominent and in agreement with other studies.1
Within the 2012–15 cohort, 26.8% of all FSD patients and 44.5% of those with multimorbidity had at least one severe or extremely severe condition. Our data also show multimorbidity increasing with age, peaking at age 45–64 years and then decreasing for non-Aboriginal patients aged ≥65 years. The reasons for this are unclear. The fact that multimorbidity is less severe in this latter age category for non‑Aboriginal patients suggests patients who are healthier are more likely to survive and remain users of the service. The flattening of the S-shaped prevalence curve19 could suggest diminished survival beyond age 45 years, reflecting the UK experience where the average age at death among homeless persons is 40–44 years.9 It could also reflect that the less able are more likely to be in more stable accommodation (sheltered housing/nursing home), off the streets and therefore less likely to use the service.
The flattening of the prevalence curve for Aboriginal patients aged ≥45 years (Figure 1C) was comparatively less pronounced. The reasons for this are again unclear but it is possible, given the lower numbers attending within this age category for this group and the higher level of disease severity, that older, less healthy Aboriginal patients continue using the service. Further research involving longitudinal follow-up of patients through hospital and mortality databases will assist in clarification for both patient groups, although follow-up may prove challenging given the marginalised status of the population.
An important aspect of our study is the high Aboriginal attendance, comprising 31.5% of the total cohort (with 50.8% female) compared to <2% Aboriginal patients attending mainstream GP clinics Australia-wide.20 Equally noteworthy is the progressive increase in the proportion of Aboriginal patients attending FSD between the two data periods.
Primary care management of young Aboriginal patients is critical in preventing exacerbations of chronic, multimorbid conditions. Being of Aboriginal descent is the strongest predictor of multimorbidity with these patients, who are 2.1 times more likely to have multimorbidity compared to non-Aboriginal patients. Although Aboriginal patients are younger, they have higher rates of multimorbidity across all age groups.
Studies show barriers to homeless individuals seeking primary healthcare are multifactorial21 and have been explored for the FSD in our previous publication.14 This can lead to repeated use of hospital EDs,22 often for conditions that ideally should be managed in primary care.23 While ED attendance has been identified as an opportunity in health intervention for homeless patients,22 ED social work services struggle to meet such needs.16 Hospital discharge planning is difficult for patients with no fixed abode and no regular doctor. Although discharge summaries from hospital EDs may be directed to the FSD, there is no guarantee of patients attending the service or of seeing the same GP at future visits. GP-led, in-reach services are a possible solution for this impasse, although varying success has been reported.24
Cost analysis of patient visits to FSD compared to GP or hospital ED visits has not been included in the study. An Australian national study report25 on the cost of homelessness provides evidence of the diversity in health cost impact for this cohort. The report argues against the use of point estimates because of this diversity, suggesting instead that the focus should be on trends in magnitude and direction. We envisage that for the FSD the cost per consultation will be higher mainly because the street-based service is tailored to meet the special needs of this population through additional ancillary onsite services (Aboriginal health workers, outreach workers and social workers). However, compared to hospital ED attendance costs, the FSD is likely to represent a substantial overall cost saving. In addition, the flow-on effect of increased hospital admissions may be mitigated if the physical and mental health issues of this population are addressed at an earlier stage.
Implications for general practice
Our data show that multimorbdity is increasing and presents as chronic physical and mental health problems in marginalised, street health patients. Such patients run the risk of ongoing neglect unless provided with a no-cost, multidisciplinary approach capable of delivering health and social services in a non-judgemental, comfortable and secure environment.
The progressive increase in attendance by young, especially Aboriginal, patients over the past decade, and the positive feedback from patients and allied services regarding service use,14 make a compelling argument that accredited, general practice–based services such as the FSD are addressing important health and social needs in an environment where they are most needed.
| Appendix 1: Conditions rated within domains |
| Domain |
Conditions |
| Musculoskeletal/integumental |
1. Osteoarthritis
2. Osteoporosis
3. Rheumatoid arthritis
4. Chronic back pain
5. Skin disorders |
| Psychiatric |
6. Anxiety
7. Depression
8. Psychosis
9. Drug abuse
10. Alcohol abuse
11. Other psychiatric |
| Respiratory |
12. Asthma
13. Chronic obstructive pulmonary disease
14. Smoking |
| Vascular |
15. Peripheral vascular disease
16. Hyperlipidaemia
17. Abdominal aortic aneurysm
18. Coronary artery bypass graft surgery
19. Other vascular including hypertension |
| Endocrine |
20. Diabetes
21. Metabolic disorder
22. Breast
23. Obesity
24. Menopause
25. Other endocrine |
| Eye, ear, nose and throat |
26. Eye problems
27. Ear, nose and throat problems
28. Dizziness |
| Genitourinary/prostate |
29. Genitourinary/prostate |
| Lower gastrointestinal |
30. Abdominal surgery
31. Other gastrointestinal problems |
| Haematological |
32. Anaemia
33. Other haematological |
| Upper gastrointestinal |
34. Stomach
35. Oesophagus
36. Gastro-oesophageal reflux disease |
| Neurological |
37. Cerebrovascular accident
38. Other neurological |
| Cardiac |
39. Ischaemic heart disease
40. Chronic heart failure
41. Other cardiac |
| Hepatic/pancreatic |
42. Hepatic/pancreatic |
| Renal |
43. Renal |
| Appendix 2. Five most common domain combinations for patients 2012–2015 cohort compared with 2006–2011 cohort |
| All patients, n (%) |
Aboriginal, n (%) |
Non-Aboriginal, n (%) |
| 2012–2015 cohort |
| Musculoskeletal |
139 (34.6) |
Musculoskeletal |
55 (43.0) |
Psychiatric |
79 (31.1) |
| Psychiatric |
108 (26.9) |
Psychiatric |
24 (18.8) |
Musculoskeletal |
77 (30.3) |
| Respiratory |
46 (11.4) |
Eye, ear, nose and throat |
15 (11.7) |
Respiratory |
29 (11.4) |
| Eye, ear, nose and throat |
22 (5.5) |
Respiratory |
15 (11.7) |
Urogenital and prostate |
16 (6.3) |
| Urogenital and prostate |
22 (5.5) |
Endocrine |
4 (3.1) |
Endocrine |
16 (6.3) |
| Denominator population(one domain only), n |
402 |
|
128 |
|
254 |
| Respiratory + Psychiatric |
606 (56.6) |
Respiratory + Psychiatric |
203 (52.3) |
Respiratory + Psychiatric |
389 (59.6) |
| Musculoskeletal + Psychiatric |
437 (40.8) |
Respiratory + Musculoskeletal |
172 (44.3) |
Musculoskeletal + Psychiatric |
271 (41.5) |
| Vascular + Psychiatric |
257 (24.0) |
Musculoskeletal + Psychiatric |
155 (40.0) |
Psychiatric + Endocrine |
123 (18.9) |
| Vascular + Respiratory |
249 (23.3) |
Psychiatric + Endocrine |
105 (27.1) |
Respiratory + Musculoskeletal |
236 (36.1) |
| Hepatic and pancreas + Psychiatric |
180 (16.8) |
Respiratory + Endocrine |
99 (25.5) |
Psychiatric + Vascular |
172 (26.3) |
| Denominator population (2 or more domains), n |
1,070 |
|
388 |
|
653 |
| 2006–2011 cohort |
| Musculoskeletal |
238 (29.8) |
Musculoskeletal |
74 (34.3) |
Musculoskeletal |
164 (28.2) |
| Psychiatric |
162 (20.3) |
Psychiatric |
28 (13.0) |
Psychiatric |
134 (23.0) |
| Eye, ear, nose and throat |
109 (13.7) |
Eye, ear, nose and throat |
41 (19.0) |
Eye, ear, nose and throat |
68 (11.7) |
| Respiratory |
75 (9.4) |
Respiratory |
18 (8.3) |
Respiratory |
57 (9.8) |
| Urogenital and prostate |
55 (6.9) |
Lower GIT |
13 (6.0) |
Urogenital and prostate |
43 (7.4) |
| Denominator population (one domain only), n |
798 |
|
216 |
|
582 |
| Respiratory + Psychiatric |
445 (37.1) |
Respiratory + Psychiatric |
153 (39.6) |
Respiratory + Psychiatric |
292 (35.9) |
| Musculoskeletal + Psychiatric |
388 (32.4) |
Musculoskeletal + Psychiatric |
136 (35.2) |
Musculoskeletal + Psychiatric |
252 (31.0) |
| Respiratory + Musculoskeletal |
307 (25.6) |
Respiratory + Musculoskeletal |
121 (31.4) |
Respiratory + Musculoskeletal |
186 (22.9) |
| Vascular + Musculoskeletal |
175 (14.6) |
Respiratory + Endocrine |
78 (20.2) |
Vascular + Musculoskeletal |
114 (14.0) |
| Psychiatric + Vascular |
168 (14.0) |
Psychiatric + Endocrine |
74 (19.2) |
Respiratory + Vascular |
95 (11.7) |
| Denominator population (2 or more domains), n |
1,199 |
|
386 |
|
813 |
GIT, gastrointestinal tract